
Figure 2.
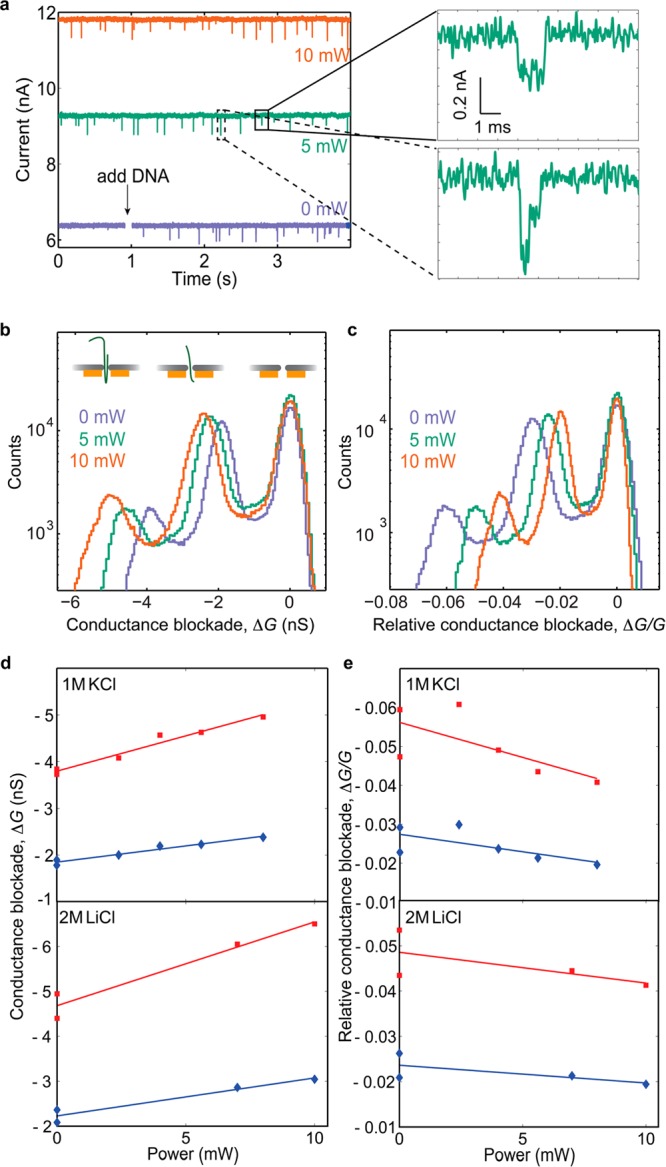
DNA translocations through a plasmonic solid-state nanopore. (a) Examples of current traces in 1 M KCL without (purple) and with (green, orange) plasmon excitation (longitudinal mode). The panels to the right show the details of one linear (top) and one partially folded (bottom) translocation event upon 5 mW laser excitation. (b) Conductance blockade histograms for DNA translocations in 1 M KCl at 0 mW (purple), 5 mW (green), and 10 mW (orange) laser excitation. (c) Same as in (b), but for the relative conductance blockades (blockades normalized with the open pore conductance at each power). (d) Position of the conductance blockade peaks versus power for measurements in 1 M KCl (top) and 2 M LiCl (bottom). Diamonds and squares correspond to the first and the second translocation peak, respectively. (e) Same as in (d), but for the relative conductance blockades. The lower points (lower absolute values) at 0 mW corresponds to the last acquisition during the experiments.