
Figure 4.
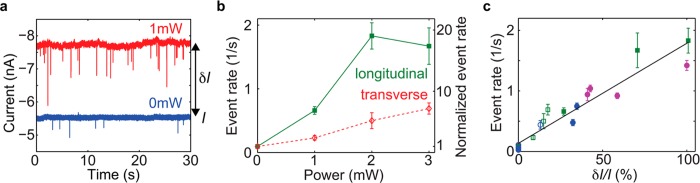
Plasmon-induced event rate enhancement in 2 M LiCl. (a) Examples of current traces at 0 mW (blue) and 1 mW laser excitation in longitudinal mode. The DNA was added to the side of the antenna, thereof the negative currents. (b) Event rate (left y-axis) and event rate normalized with the initial value at 0 mW (right y-axis) versus laser power for the same plasmonic nanopore as in (a), excited in longitudinal mode (green filled squares) and in transverse mode (red open diamonds). The error bars correspond to the statistical error of the mean. (c) Event rate versus relative increase in the open pore current upon laser excitation, δI/I. Different colors correspond to different plasmonic nanopores. Filled and open symbols are for longitudinal and transverse polarization, respectively. Squares and circles correspond to DNA added from the side of the bowtie antenna and the other side, respectively. The black full line is a linear fit to all data. The green markers correspond to the data in (b).