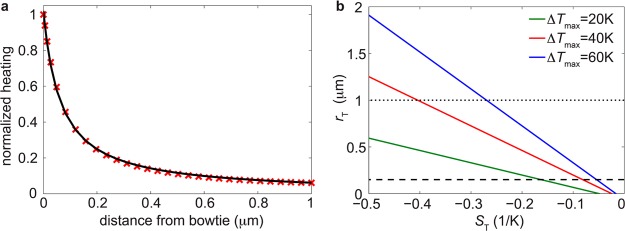
Figure 5.

Analysis of thermophoretic effects in plasmonic nanopores. (a) Normalized heating profile away from the antenna in the orthogonal direction to the membrane, starting at the top of the bowtie nanoantenna at the gap center. The red markers are results from the finite-element simulation and the black full curve is a fit to eq 2, using a = 0.06581 μm and b = 0.06425 μm. (b) Estimated thermophoretic capture distance (rT) versus the Soret coefficient (ST) for local heating of the nanopore at different temperatures. The dashed and dotted lines correspond to the estimated electrophoretic capture radii in 2 M LiCl and 1 M KCl, respectively.
