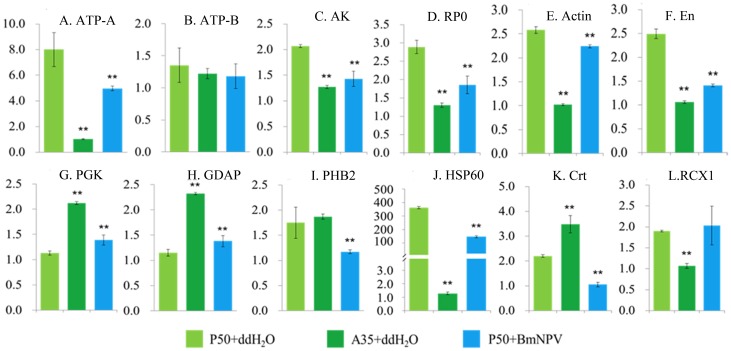
Figure 4. Real-time PCR analysis of expression profiles of BmNPV binding proteins in B. mori midguts.
Columns with different colors indicated the experimental treats to the larvae. A to L refer to relative expression level of ATP-A, ATP-B, AK, RP0, Actin, En, PGK, GDAP, PHB2, HSP60, Crt, and RCX1 respectively. Data were normalized usingBmrps3and represented as means±standard errors of the means from three independent experiments. ** Indicates statistical significance<0.01(ANOVA and LSD aposteriori test).

