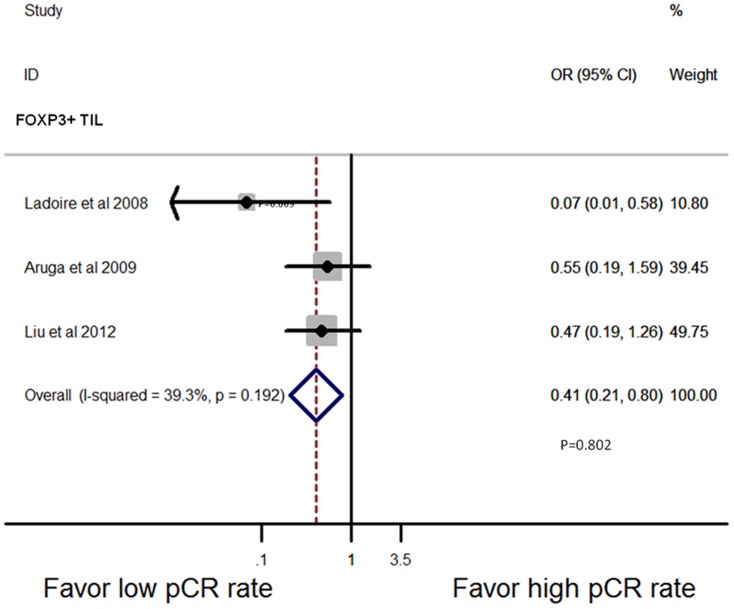
Figure 6. Forest plots from the fixed-effect meta-analysis of the efficacy of TILs subset on NAC response in post-treatment breast tissue.
The width of horizontal line represents 95% CI of the individual studies, and the grey boxes represent the weight of each study. The diamond represents the overall summary estimate. The unbroken vertical line was set at the null value (HR = 1.0).

