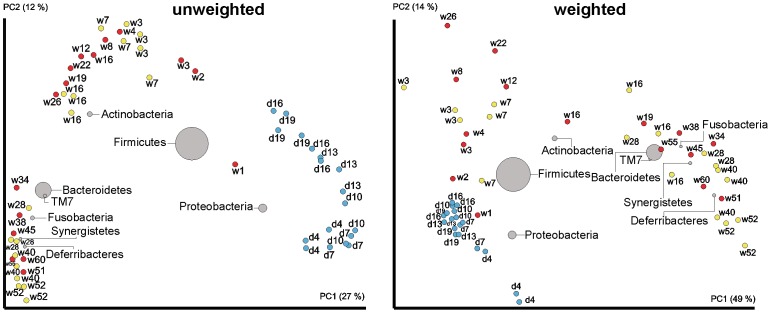
Figure 2. Unweighted and weighted BiPlot PCoA analysis of chicken caecal microbiota.
Red spots, pooled samples from the long-term on-farm experiment. Blue spots, individual chicken samples from the short-term animal house experiment. Yellow spots, individual samples from chicken and hens of particular age. “d” stands for age in days, “w” stands for age in weeks. Size and location of the bacterial spots represent their amount and association with microbiota of chickens and hens of a particular age.

