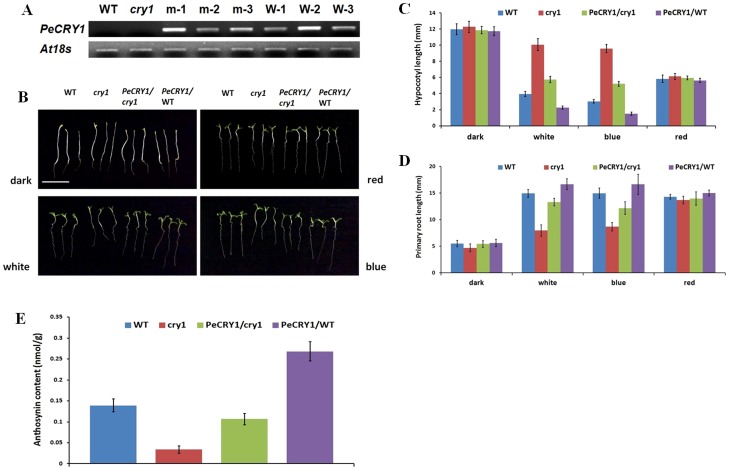
Figure 6. Phenotypes of wild-type (WT), cry1-mutant, PeCRY1-transgenic cry1-mutant, and PeCRY1-transgenic WT plants.
(A) PeCRY1 transcript levels in WT, cry1 mutant, and transgenic lines. m-1, m-2, and m-3, three cry1 mutant lines transformed with PeCRY1; W-1, W-2, and W-3, three WT lines transformed with PeCRY1. (B) Phenotypes of WT, cry1-mutant, and the two transgenic lines (m-1 and W-2) grown under dark, white, blue, and red light. Scale bar represents 1 cm. (C) and (D) Hypocotyl and primary root lengths of WT, cry1-mutant, and the two transgenic lines grown under dark, white, blue, and red light. (E) Anthocyanin content of WT, cry1-mutant, and the two transgenic lines grown under blue light.

