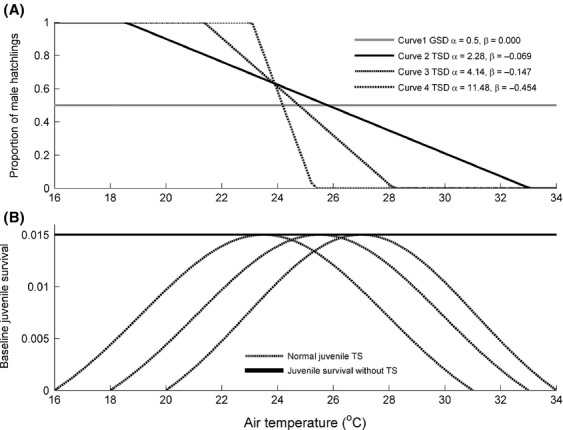
Figure 1.

Cohort sex ratio (CSR) response curves and baseline embryonic survival curves. (A) CSR response curves for GSD (Curve 1). TSD (Curve 3) uses the regression equation parameters for the slope and intercept estimated from data on the painted turtle (Schwanz et al. 2010). TSD (Curves 2 and 4) use parameters for species with shallower and steeper slopes for CSR response curves, respectively. (B) Normal (dashed) distributions (TS curves) of baseline embryonic survival a distributed along temperature gradients 1, 2, and 3. Maximum baseline embryonic survival (a max = 0.015) is denoted by the solid line.
