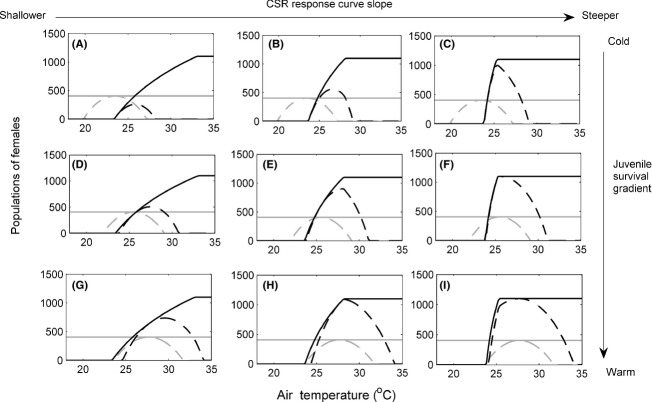
Figure 3.
Populations of females for various combinations of temperature-dependent sex determination (TSD) (black lines) and genotypic sex determination (GSD) (gray lines) with (dashed lines) and without (solid lines) temperature-dependent embryonic survival (TS). Males do not limit female fecundity (b = 0). Cool embryonic survival gradient (A) to (C). Intermediate embryonic survival gradient (D) to (F). Hot embryonic survival gradient (G) to (I). TSD is shown with (A), (D), and (G) CSR response curve 2 (slope β = −0.069), (B), (E), and (H) CSR response curve 3 (slope β = −0.147) and (C), (F), and (I) CSR response curve 4 (slope β = −0.454).

