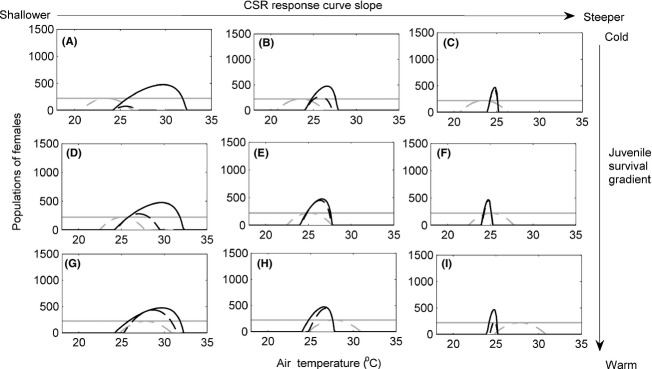
Figure 5.

Populations of females for various combinations of temperature-dependent sex determination (TSD) (black lines) and genotypic sex determination (GSD) (gray lines) with (dashed lines) and without (solid lines) temperature-dependent embryonic survival (TS). Strong level of male limitation on female fecundity (b = 0.1). Cool embryonic survival gradient (A) to (C). Intermediate embryonic survival gradient (D) to (F). Hot embryonic survival gradient (G) to (I). Temperature-dependent sex determination (TSD) is shown with (A), (D), and (G) CSR response curve 2 (slope β = −0.069), (B), (E), and (H) CSR response curve 3 (slope β = −0.147) and (C), (F), and (I) CSR response curve 4 (slope β = −0.454).
