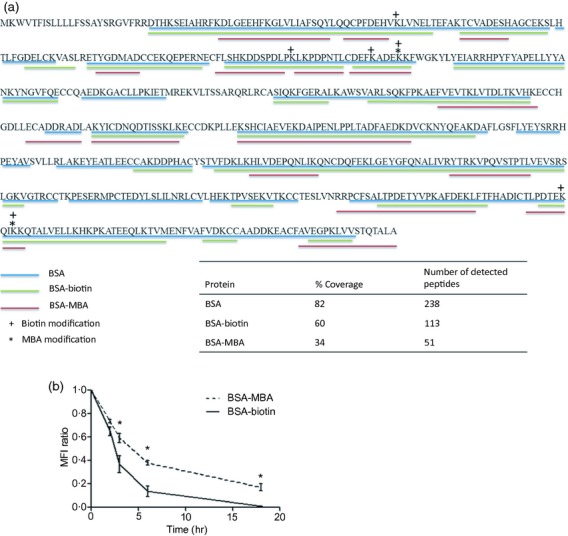
Figure 5.

Degradation of haptenated BSA by lysosomal proteases and in live cells. BSA–biotin or BSA–mannosamine–biotin (MBA) were incubated for 24 hr with macrophage (RAW 264.7) cell line lysate in sodium acetate buffer. (a) Degradation products of BSA, BSA–biotin or BSA–MBA were analysed by LC–MS/MS for peptide sequence. (b) Macrophages were incubated with haptenated carriers, BSA–biotin or BSA–MBA, for 3 hr. The level of the haptenated carriers was monitored at various time points up to 18 hr. The cells were fixed, permeabilized and intercellularly stained with avidin–FITC. Fluorescence analysis was performed by flow cytometry. The results are shown as calculation of geometric mean fluorescence intensity (MFI) ratio between time 0 and four time-points over 18 hr (±SD of three independent experiments). *P < 0.05 for the differences in the degradation rates between BSA–MBA and BSA–biotin.
