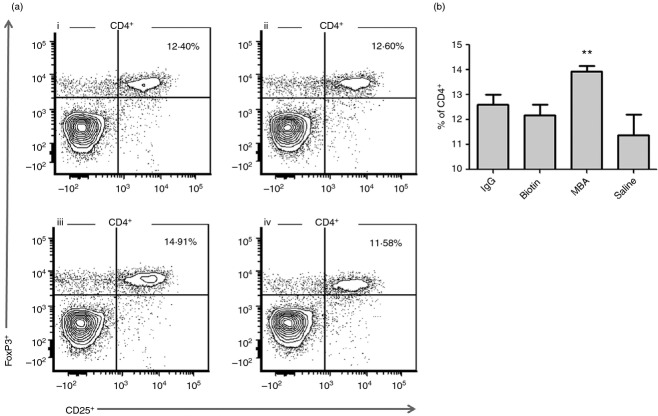
Figure 6.
T regulatory (Treg) cell population by flow cytometry analysis. Splenocytes were isolated and stained for CD4+ and CD25+ followed by intracellular staining for FoxP3+. CD25+, FoxP3+ cell frequencies out of CD4+ within the indicated gates are shown. Mice were immunized with horse serum (hs) IgG (i), hsIgG–biotin (ii), hsIgG– mannosamine–biotin (MBA) (iii), and saline (iv) (n = 6) and data represent two independent experiments (a). Bar values represent FoxP3+ percentage mean of gated CD4+ (±SD) (b). **P < 0.01 for the differences between hsIgG–MBA- and hsIgG-, hsIgG–biotin- or saline-immunized mice.

