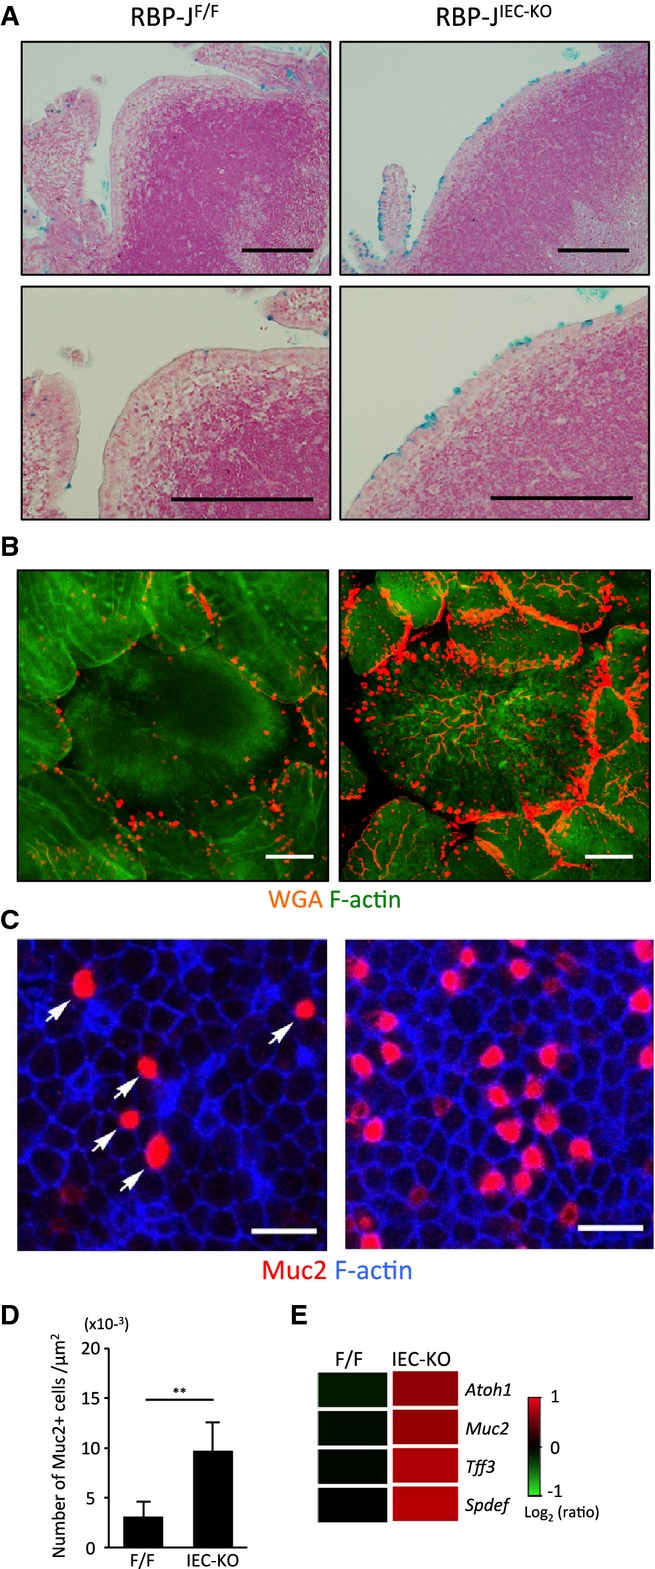
Figure 2.

Goblet cell hyperplasia in follicle-associated epithelium (FAE) of RBP-JIEC-KO mice
A Peyer's patch (PP) tissue sections from RBP-JIEC-KO and control (RBP-JF/F) mice were stained with Alcian blue to detect goblet cells, followed by nuclear fast red counterstaining. Scale bars represent 200 μm.
B, C Whole-mount specimens of PPs were stained with wheat germ agglutinin (B) or antibodies against mucin-2 (Muc2) (C) to detect goblet cells. F-actin was stained with phalloidin. Scale bars represent 100 (B) or 20 (C) μm.
D The number of Muc2+ cells in FAE (μm2) was quantified. Data are representative of two independent experiments with similar results. Values are presented as the mean ± standard deviation (n = 3). **P < 0.01, as calculated with the Student's t-test.
E Gene expression profiles of FAE from RBP-JIEC-KO and control mice are shown. The heat map represents expression levels of goblet cell-associated genes.
Source data are available online for this figure.
