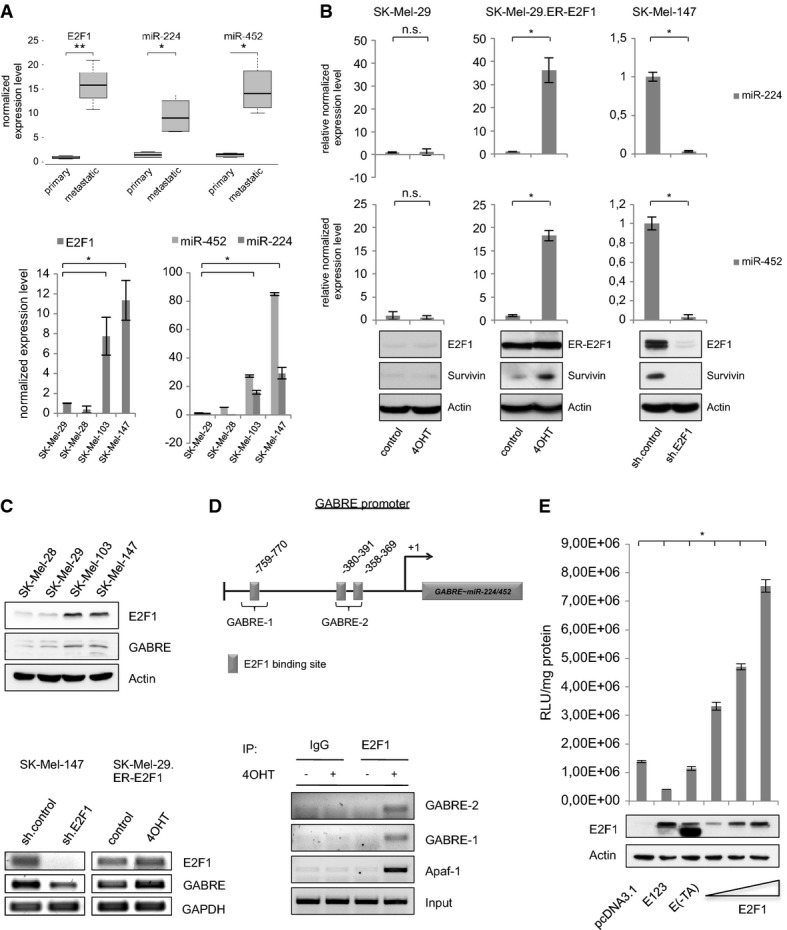
Figure 1.

E2F1 regulates miR-224 and miR-452 by transactivating their host gene GABRE
A Quantification of E2F1, miR-224 and miR-452 expression determined by real-time PCR and TaqMan® MicroRNA single assays in primary tumor samples and non-invasive melanoma cell lines (SK-Mel-28, SK-Mel-29) versus metastases and highly metastatic SK-Mel-103 and SK-Mel-147 cells.
B E2F1 activates miR-224/452. Normalized miRNA expression is shown in stable SK-Mel-29.ER-E2F1 cells treated with 4OHT or solvent (control; middle panel) compared to parental SK-Mel-29, and in SK-Mel-147 cells expressing control or E2F1-specific shRNA. E2F1, ER-E2F1 and survivin expression was verified by Western blot. Actin served as a loading control.
C MiR-224/452 cluster is co-expressed with its host gene GABRE. GABRE and E2F1 expression in metastatic (SK-Mel-103 and -147) versus non-metastatic (SK-Mel-28 and -29) cells was verified by Western blot. GABRE transcript levels were analyzed after E2F1 knockdown in SK-Mel-147 and activation in SK-Mel-29.ER-E2F1.
D Scheme of the GABRE promoter showing relevant E2F-binding sites (GABRE-1, GABRE-2) upstream of the transcriptional start site (+1). Binding of E2F1 was verified by ChIP in SK-Mel-29.ER-E2F1 cells (treated with 4OHT (+), or solvent (−)) using E2F1 or IgG antibody. APAF-1 promoter served as a positive control.
E E2F1 directly activates GABRE. Relative luciferase activities (RLU) measured 36 h after co-transfection of GABRE promoter construct and increasing amounts (0.5, 1, 2 μg) of E2F1 expression plasmid or E2F mutants E(-TA) and E123 (2 μg). Protein expression was verified by Western blot. Actin served as a loading control.
Data information: Bar graphs are represented as means ± SD, n = 3, *P ≤ 0.05, two-sided Student's t-test. Box-whisker plots: Boxes indicate the 25 and 75% quartile surrounding the median (n = 4), *P ≤ 0.05, **P ≤ 0.01, two-sided Student's t-test. The lines represent the minimum and maximum transcript levels.
