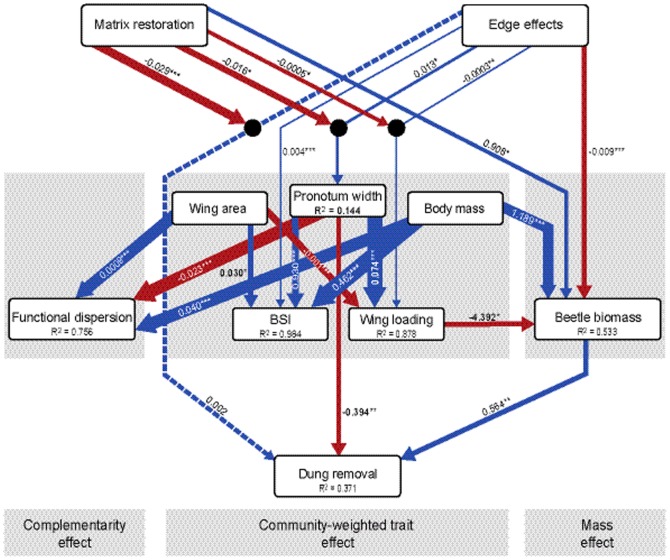
Figure 3. Causal pathways of functional responses to edge effects and matrix restoration.
Best-fit generalized multilevel path model structure (χ2 = 44.964, df = 54, P = 0.805) as determined by the B U set of independence claims (Table S4). Boxes depict predictor and response variables and arrows indicate significant positive (blue) and negative (red) effects, with non-significant effects indicated by a dashed arrow. Circular nodes with arrows leading to them represent interaction terms. R2 values in the endogenous variables indicate the strength of fit for individual models. Values within and adjacent to arrows are the unstandardized path coefficients with level of significance (* p<0.05, ** p<0.01, *** p<0.001). Line weightings indicate the relative strength of effects as derived from the standardized path coefficients.

