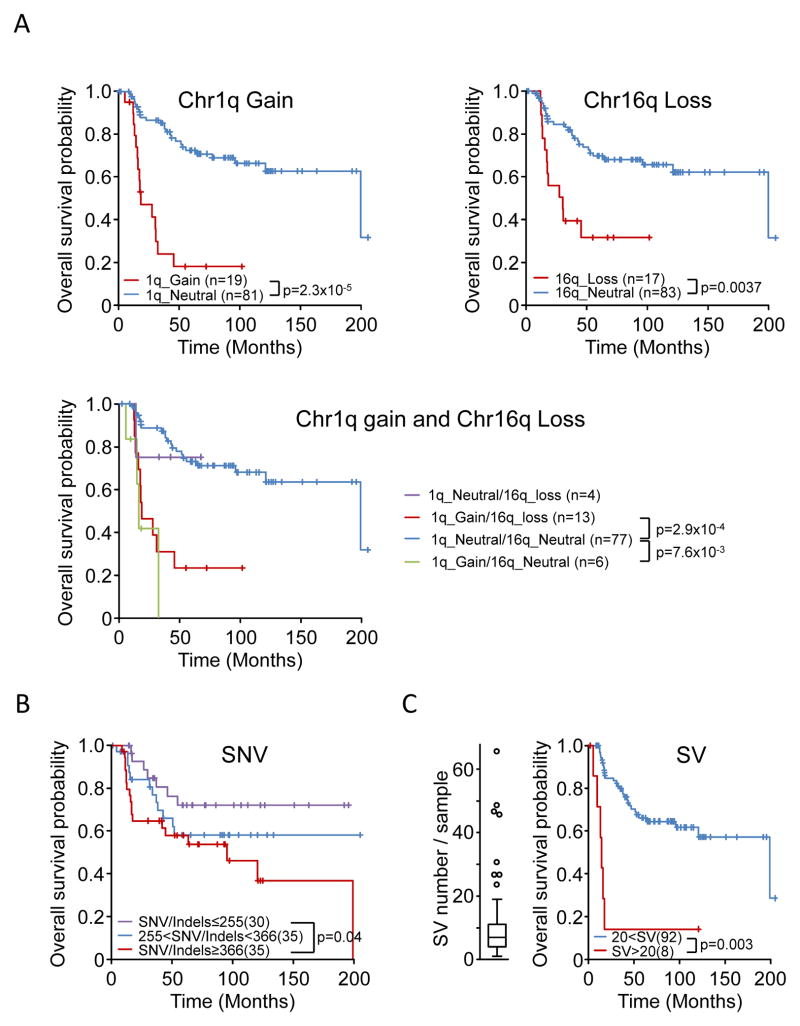
Figure 2. Prognostic significance of CNAs, SVs, and SNV/indels.
Kaplan-Meier overall survival estimates according to A) Chromosome 1q gain, chromosome 16q loss; chromosome 1q gain and 16qloss; B) number of SNV/indels. Samples were stratified according to the number of genomic SNVs/indels and split into tertiles; C) a large number of SVs. The overall survival of patients whose tumors harbor an outlier number of SVs (boxplot distribution shown on the left) is compared to that of other patients. Patients with a fractured genome, low tumor purity, or death of causes other than Ewing sarcoma were excluded from the analysis.

