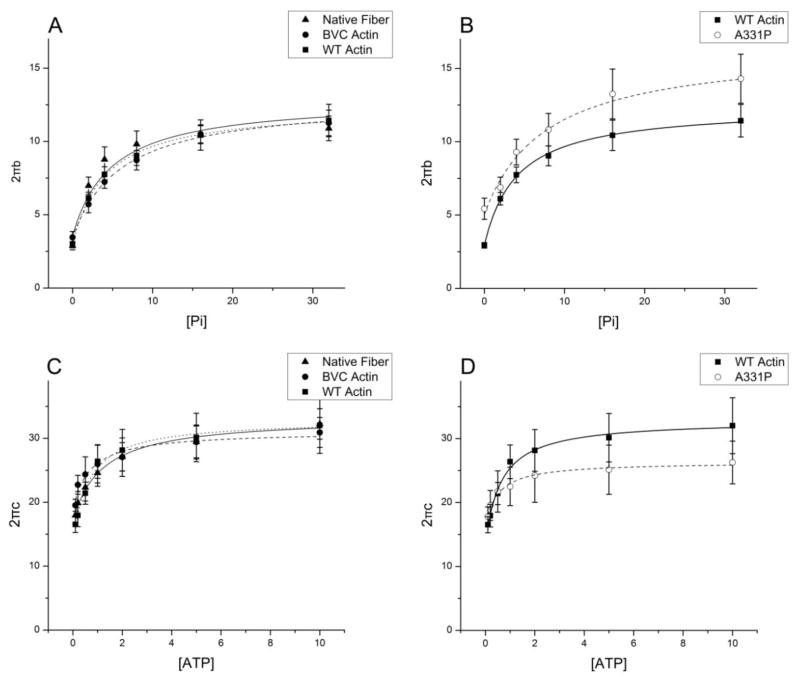
Figure 7. Apparent rate constants of native fibers, BVC actin reconstituted fibers, WT actin reconstituted fibers, and A331P actin reconstituted fibers followed by reconstitution with Tm/Tn.
Two apparent rate constants, 2πb and 2πc, are plotted against [Pi] and [MgATP]. Symbols represent the mean ± SE. Continuous curves were generated by fitting the data to Eq. 3 (A–B) or Eq. 4 (C–D) of ref [28]. A–B: 2πb is plotted against [Pi]. C–D: 2πc is plotted against [MgATP]. (▲: Native fibers; ●: BVC actin reconstituted fibers; ■: WT actin reconstituted fibers; ○: A331P actin reconstituted fibers; N=7–10).

