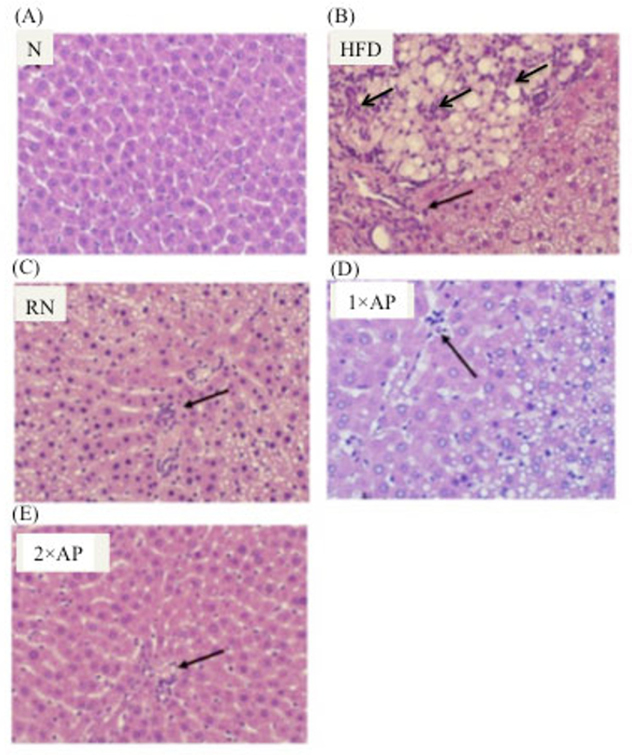
Fig. 2.

H & E stain of hepatic tissue sections in the groups. Pictures were taken under 400 times magnification. Interpreting by Brunt’s method, (A) grade 0 fatty liver and inflammation (B) grade 3 fatty liver and grade 2-3 inflammation (C) grade 2 fatty liver and grade 1-2 inflammation (D) grade1-2 fatty liver and grade 0-1 inflammation (E) grade 0-1 fatty liver and grade 0-1 inflammation. The arrow-pointing area indicated neutrophil infiltration foci in the tissue section.
