
Fig. 2.
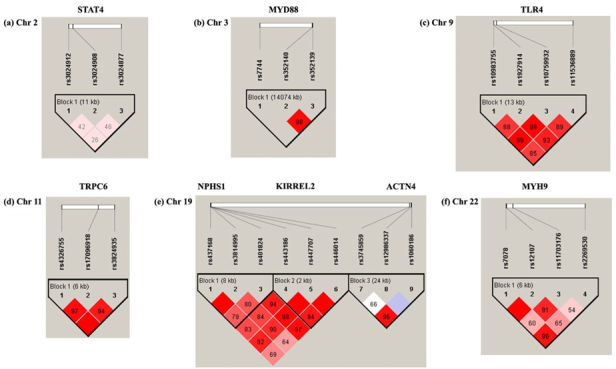
LD and haplotype block structure of genes associated with MN by different chromosomes: (a) Chr2 (b) Chr3 (c) Chr9 (d) Chr11 (e) Chr19 (f) Chr22. Color scheme of linkage disequilibrium LD map is based on standard D’/LOD option in Haploview software, LD blocks calculated based on CI method.