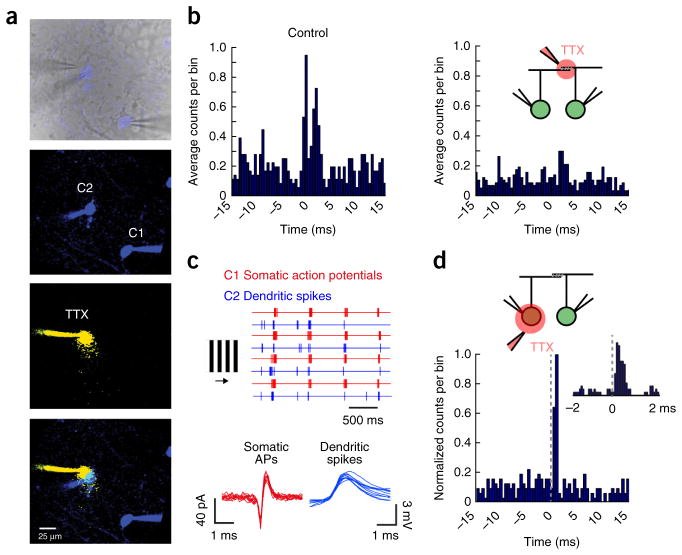
Figure 4.
Dendritic spikes appear to mediate gap junction–dependent fine-scale synchronization. (a) Top, an infrared image depicting the recording configuration (a fluorescent image is overlaid to show Hb9+ GFP cells in blue). The panels below show fluorescent images of the Alexa 488–filled somata of neighboring cRGCs (green channel shown in blue), the local TTX puff imaged in a separate channel (Alexa 594 was included in the puff pipette, red channel shown in yellow) and an overlay of these images. (b) Cross-correlograms computed for light-evoked spike trains from a pair of cRGCs in control conditions (left) and when TTX was locally applied over the region of dendritic overlap (right). (c) Responses to drifting gratings (top, four trials) are shown for a paired recording in which TTX was locally puffed over the soma of C2. Somatic action potentials (APs) were measured extracellularly from C1 (red traces) and dendritic spikes were measured intracellularly from C2 (blue traces; see Supplementary Fig. 9 for experimental details). Individual extracellular spikes (C1, red) and dendritic spikes (C2, blue) are shown below at a higher resolution (ten events are shown for each). (d) A cross-correlogram (0.5-ms bins) plotting the distribution of dendritic spike times (measured in C2) relative to action potentials in C1 (set at time 0). The inset shows a cross-correlogram of the same events in d, but sampled at a higher time resolution (0.1-ms bins), illustrating that the dendritic spikes in C2 showed an increased probability of occurring shortly after a spike in C1.

