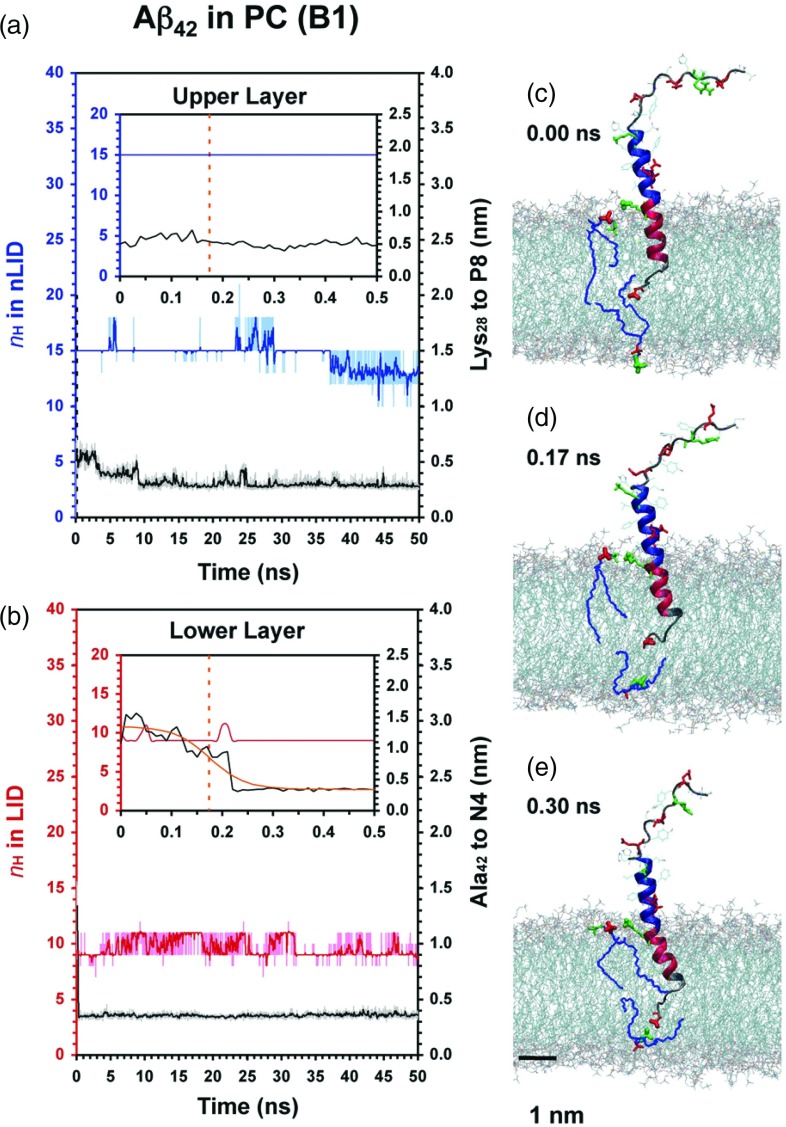
FIG. 2.
Protein conformational and protein-lipid dynamics for the folded anchoring of Aβ42 in PC. The time evolution of nH of the non-LID (blue) and LID (red), and the minimum distance between Lys28 of Aβ42 to P8 of PC (black) in the extracellular lipid leaflet (a) and that of Ala42 of Aβ42 to N4 of PC (black) in the cytofacial lipid leaflet (b) are shown. Insets show enlarged views. A 10-point running average (thick line) highlights the trend of the kinetic data. The protein conformation and the closest pairs of Lys28-P8 and Ala42-N4 are highlighted before (c), midway (d), and after (e) C-terminus diffusion to its anchor site. The sigmoidal fit of the Ala42-N4 kinetics (orange curve) and the midpoint distance at τ (orange dotted line) are shown.

