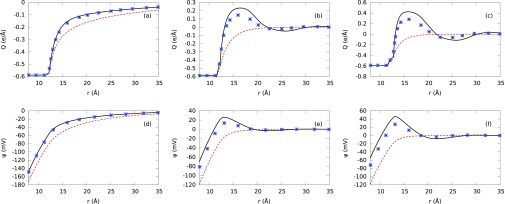
FIG. 11.

Plots (a), (b), and (c) correspond to integrated charge, whereas (d), (e), and (f) represent mean electrostatic potential. We use a, d, and f aqueous electrolyte mixtures in plots (a), (b), (c) and (d), (e), (f), respectively. Red short-dashed lines represent our NLPB predictions. Black solid lines represent our PM predictions with hydrated ionic sizes. Symbols correspond to the MC simulation results.
