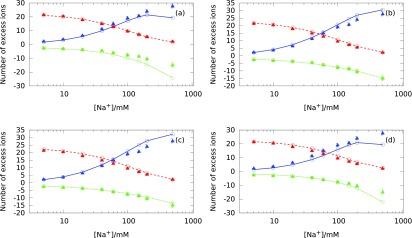
FIG. 12.

Number of excess ions around a B-DNA duplex as a function of the Na+ concentration. Different concentrations of NaCl are added into a background solution of 5mM Mg+2. Circles represent our theoretical predictions and triangular symbols represent experimental ion counting data.7 Red dashed lines correspond to Mg+2, blue solid lines correspond to Na+, and green short-dashed lines correspond to Cl−. The plots represent the comparison between our theoretical predictions against experimental data for (a) PM with hydrated ion sizes, (b) SPM with Shannon's ion sizes and (c) same ion sizes, and (d) SPM with hydrated ion sizes.
