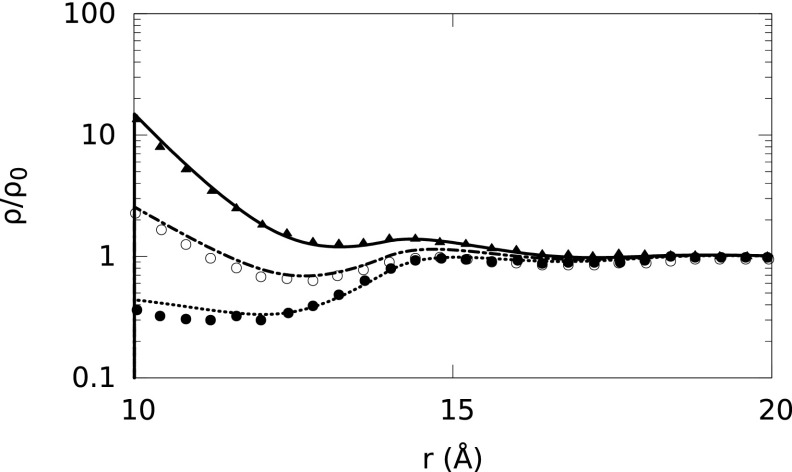
FIG. 5.
Normalized ion density profiles (ρ/ρo) around B-DNA embedded in a 1M NaCl solution. The water molecules are explicitly considered (SPM) at 10.3M concentration. The Na+, Cl−, and water molecule radii are set to 4.0 Å. Solid, dotted-dashed, and short-dashed lines represent our theoretical predictions for Na+, solvent, and Cl− ion density distributions, respectively, whereas solid triangles, empty and solid circles represent the corresponding MC simulation results, respectively.66

