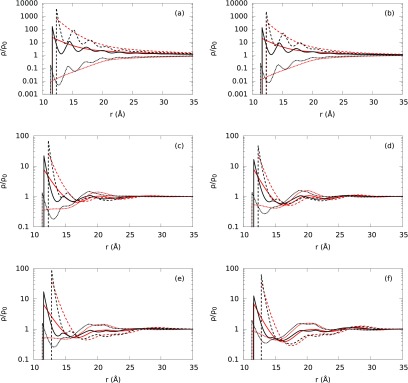
FIG. 7.

Normalized ion density profiles (ρ/ρo) around B-DNA embedded in different solvent models and electrolyte mixtures. The electrolyte mixture concentrations for (a)-(f) plots are given in Table II from top to bottom, respectively. Dashed, solid, and short-dashed lines correspond to our theoretical predictions for Mg+2 or Al+3, Na+, and Cl− ion density distributions with ion bulk concentrations described in Fig. 4. Red lines correspond to PM (without explicit water molecules) and black lines represent SPM (with explicit water molecules and hydrated ion sizes) ion density distributions at six different water concentrations from Table II.
