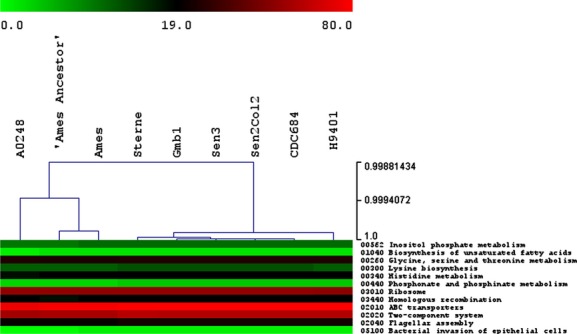
Figure 4.

Analysis of Kyoto Encyclopaedia of Genes and Genomes (KEGG) results. Hierarchical clustering of the strains based only on the difference in the KEGG distribution. Colours depend on the number of proteins implied in each category for each strain. The scale is presented in the figure.
