
Figure 4.
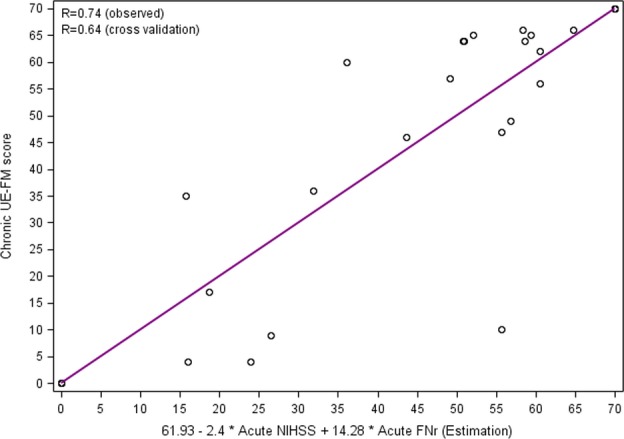
Scatterplot displaying the results of regression analysis for prediction of chronic UE-FM score on the basis of acute-phase data. The y-axis represents the UE-FM at 90 days, and the x-axis represents the estimated point based on regression 61.92867 - 2.4077 × NIHSS at acute phase + 14.2827 × FNr at acute phase. UE-FM, upper extremity Fugl-Myer test; NIHSS, National Institutes of Health Stroke Scale; FNr, fiber number ratio.