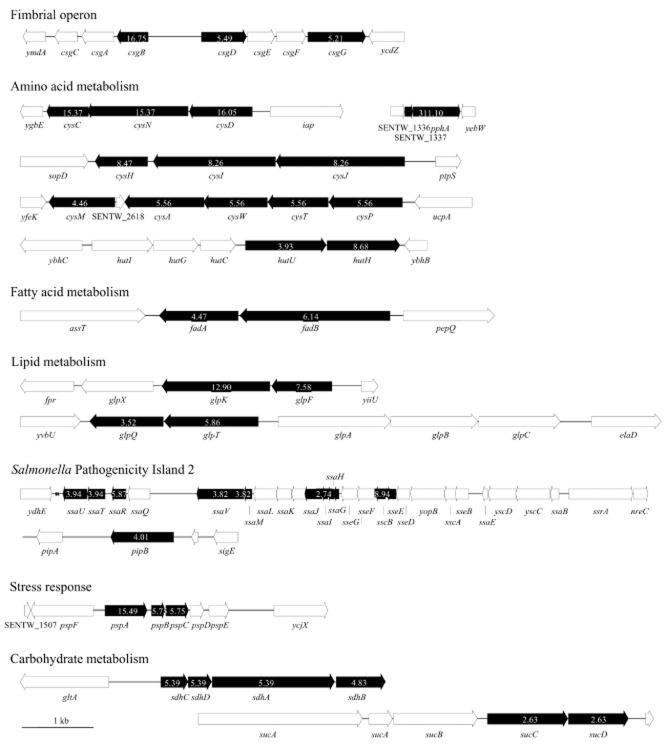
Fig 3.
Representative gene clusters of genes with higher transcription in presence of sprouts compared with M9-glucose medium. Genes with increased expression in presence of sprouts are presented as black arrows. Numbers inside arrows indicate the fold change between growth in M9-glucose medium and with sprouts as determined by RNA-seq. Genes having no significant difference in transcription level are indicated in white.

