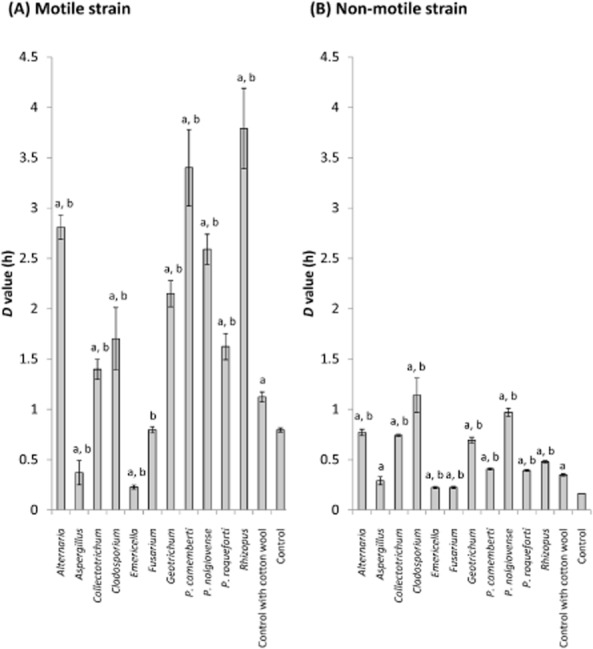
Fig 2.

D values at pH 2.5 of (A) motile and (B) non-motile strains of STEC O157 after co-culture with various fungi.Approximately 108 CFU of motile or non-motile STEC O157 was inoculated onto a 7-day-old fungal colony grown on PDA. As control, the same amount of STEC O157 was inoculated onto PDA without fungi. In addition, to investigate the effect of a filamentous structure per se on the stress resistance of STEC O157, the bacterium was inoculated onto a sterilized rectangular cotton wool (width 20 × depth 40 × height 4 mm) that was placed onto PDA as ‘control with cotton wool’. After 7-day incubation at 25°C, the agar strip was crushed and suspended in PBS. The suspension was mixed at a full speed by using an automatic mixer and centrifuged at 4000 × g for 10 min. The supernatant was removed, and the pellet washed twice with PBS. The pellet was re-suspended again with PBS and was diluted 100-fold into 10 ml of EG medium acidified with hydrogen chloride at pH 2.5. EG medium is commonly used in evaluating acid resistance of E. coli (Lin et al., 1996). The broth was incubated at 37°C, and the population of STEC O157 was measured at 0, 1, 2 and 4 h. To enumerate STEC O157, the inoculated broth was serially diluted with PBS and pour-plated onto TSA. After incubation for 48 h at 37°C, colonies were counted. D values were calculated using the formula (D value = −1/slope), where slope represents the linear regression of the data including all the sampling points. The R2 values of the linear regression analyses were more than 0.8 in every analysis. The experiments were performed in triplicate. Error bars represent the standard deviation of the three trials. Each letter in the figures represents a significant difference by Student's t-test as follows:A. P < 0.05 compared to the control.B. P < 0.05 compared to the control with cotton wool.
