
Table 3.
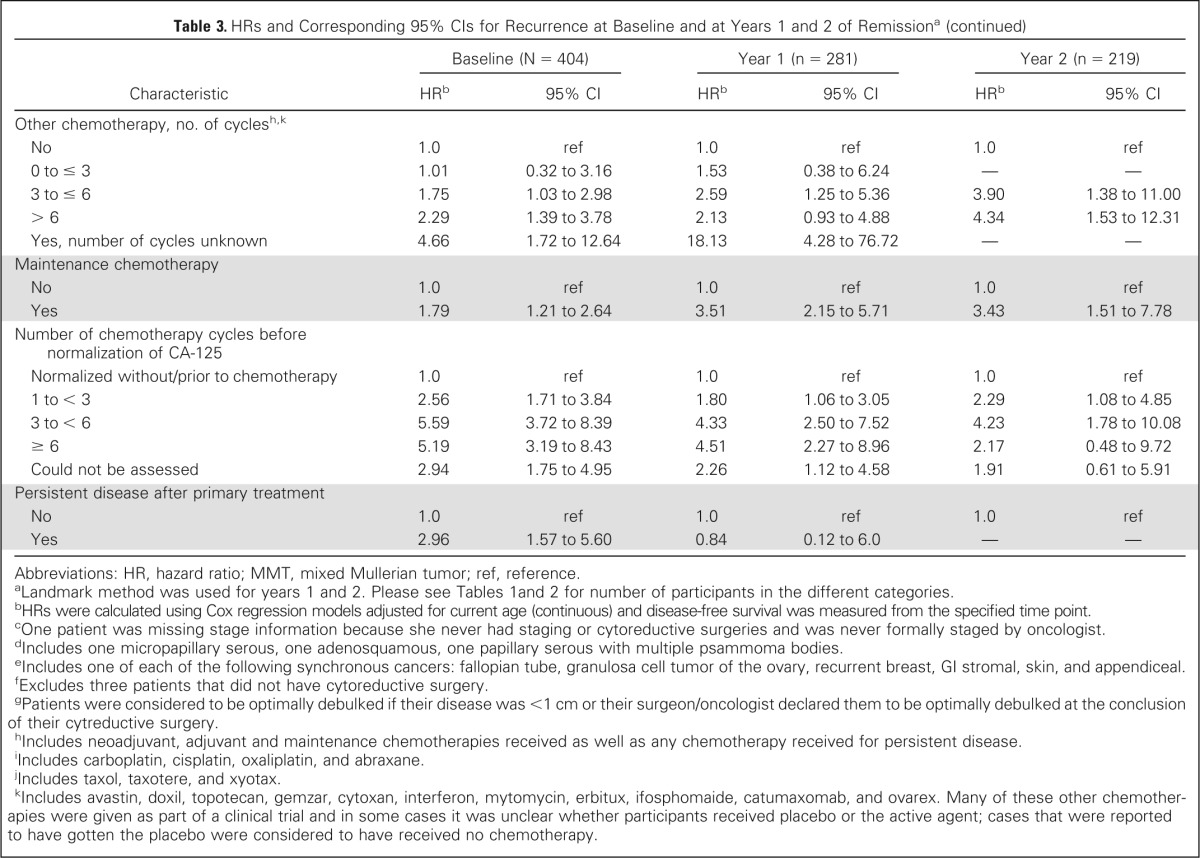
HRs and Corresponding 95% CIs for Recurrence at Baseline and at Years 1 and 2 of Remissiona
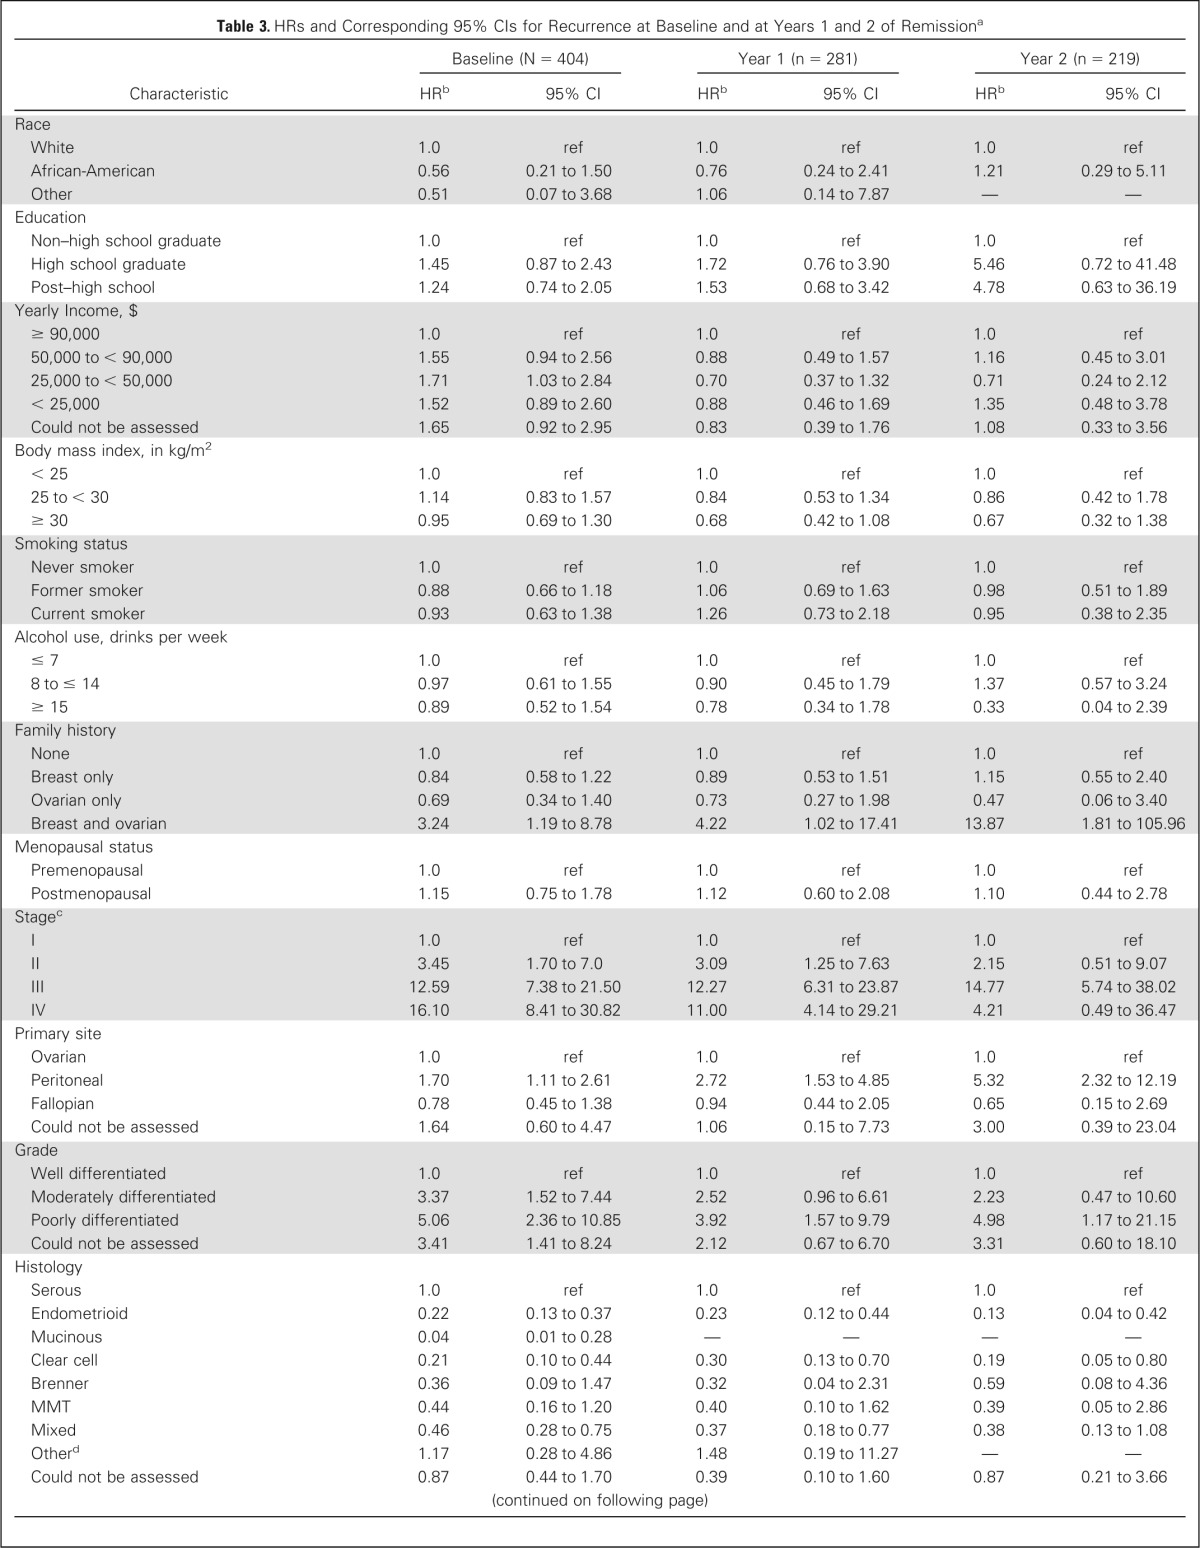

| Characteristic | Baseline (N = 404) |
Year 1 (n = 281) |
Year 2 (n = 219) |
|||
|---|---|---|---|---|---|---|
| HRb | 95% CI | HRb | 95% CI | HRb | 95% CI | |
| Race | ||||||
| White | 1.0 | ref | 1.0 | ref | 1.0 | ref |
| African-American | 0.56 | 0.21 to 1.50 | 0.76 | 0.24 to 2.41 | 1.21 | 0.29 to 5.11 |
| Other | 0.51 | 0.07 to 3.68 | 1.06 | 0.14 to 7.87 | — | — |
| Education | ||||||
| Non–high school graduate | 1.0 | ref | 1.0 | ref | 1.0 | ref |
| High school graduate | 1.45 | 0.87 to 2.43 | 1.72 | 0.76 to 3.90 | 5.46 | 0.72 to 41.48 |
| Post–high school | 1.24 | 0.74 to 2.05 | 1.53 | 0.68 to 3.42 | 4.78 | 0.63 to 36.19 |
| Yearly Income, $ | ||||||
| ≥ 90,000 | 1.0 | ref | 1.0 | ref | 1.0 | ref |
| 50,000 to < 90,000 | 1.55 | 0.94 to 2.56 | 0.88 | 0.49 to 1.57 | 1.16 | 0.45 to 3.01 |
| 25,000 to < 50,000 | 1.71 | 1.03 to 2.84 | 0.70 | 0.37 to 1.32 | 0.71 | 0.24 to 2.12 |
| < 25,000 | 1.52 | 0.89 to 2.60 | 0.88 | 0.46 to 1.69 | 1.35 | 0.48 to 3.78 |
| Could not be assessed | 1.65 | 0.92 to 2.95 | 0.83 | 0.39 to 1.76 | 1.08 | 0.33 to 3.56 |
| Body mass index, in kg/m2 | ||||||
| < 25 | 1.0 | ref | 1.0 | ref | 1.0 | ref |
| 25 to < 30 | 1.14 | 0.83 to 1.57 | 0.84 | 0.53 to 1.34 | 0.86 | 0.42 to 1.78 |
| ≥ 30 | 0.95 | 0.69 to 1.30 | 0.68 | 0.42 to 1.08 | 0.67 | 0.32 to 1.38 |
| Smoking status | ||||||
| Never smoker | 1.0 | ref | 1.0 | ref | 1.0 | ref |
| Former smoker | 0.88 | 0.66 to 1.18 | 1.06 | 0.69 to 1.63 | 0.98 | 0.51 to 1.89 |
| Current smoker | 0.93 | 0.63 to 1.38 | 1.26 | 0.73 to 2.18 | 0.95 | 0.38 to 2.35 |
| Alcohol use, drinks per week | ||||||
| ≤ 7 | 1.0 | ref | 1.0 | ref | 1.0 | ref |
| 8 to ≤ 14 | 0.97 | 0.61 to 1.55 | 0.90 | 0.45 to 1.79 | 1.37 | 0.57 to 3.24 |
| ≥ 15 | 0.89 | 0.52 to 1.54 | 0.78 | 0.34 to 1.78 | 0.33 | 0.04 to 2.39 |
| Family history | ||||||
| None | 1.0 | ref | 1.0 | ref | 1.0 | ref |
| Breast only | 0.84 | 0.58 to 1.22 | 0.89 | 0.53 to 1.51 | 1.15 | 0.55 to 2.40 |
| Ovarian only | 0.69 | 0.34 to 1.40 | 0.73 | 0.27 to 1.98 | 0.47 | 0.06 to 3.40 |
| Breast and ovarian | 3.24 | 1.19 to 8.78 | 4.22 | 1.02 to 17.41 | 13.87 | 1.81 to 105.96 |
| Menopausal status | ||||||
| Premenopausal | 1.0 | ref | 1.0 | ref | 1.0 | ref |
| Postmenopausal | 1.15 | 0.75 to 1.78 | 1.12 | 0.60 to 2.08 | 1.10 | 0.44 to 2.78 |
| Stagec | ||||||
| I | 1.0 | ref | 1.0 | ref | 1.0 | ref |
| II | 3.45 | 1.70 to 7.0 | 3.09 | 1.25 to 7.63 | 2.15 | 0.51 to 9.07 |
| III | 12.59 | 7.38 to 21.50 | 12.27 | 6.31 to 23.87 | 14.77 | 5.74 to 38.02 |
| IV | 16.10 | 8.41 to 30.82 | 11.00 | 4.14 to 29.21 | 4.21 | 0.49 to 36.47 |
| Primary site | ||||||
| Ovarian | 1.0 | ref | 1.0 | ref | 1.0 | ref |
| Peritoneal | 1.70 | 1.11 to 2.61 | 2.72 | 1.53 to 4.85 | 5.32 | 2.32 to 12.19 |
| Fallopian | 0.78 | 0.45 to 1.38 | 0.94 | 0.44 to 2.05 | 0.65 | 0.15 to 2.69 |
| Could not be assessed | 1.64 | 0.60 to 4.47 | 1.06 | 0.15 to 7.73 | 3.00 | 0.39 to 23.04 |
| Grade | ||||||
| Well differentiated | 1.0 | ref | 1.0 | ref | 1.0 | ref |
| Moderately differentiated | 3.37 | 1.52 to 7.44 | 2.52 | 0.96 to 6.61 | 2.23 | 0.47 to 10.60 |
| Poorly differentiated | 5.06 | 2.36 to 10.85 | 3.92 | 1.57 to 9.79 | 4.98 | 1.17 to 21.15 |
| Could not be assessed | 3.41 | 1.41 to 8.24 | 2.12 | 0.67 to 6.70 | 3.31 | 0.60 to 18.10 |
| Histology | ||||||
| Serous | 1.0 | ref | 1.0 | ref | 1.0 | ref |
| Endometrioid | 0.22 | 0.13 to 0.37 | 0.23 | 0.12 to 0.44 | 0.13 | 0.04 to 0.42 |
| Mucinous | 0.04 | 0.01 to 0.28 | — | — | — | — |
| Clear cell | 0.21 | 0.10 to 0.44 | 0.30 | 0.13 to 0.70 | 0.19 | 0.05 to 0.80 |
| Brenner | 0.36 | 0.09 to 1.47 | 0.32 | 0.04 to 2.31 | 0.59 | 0.08 to 4.36 |
| MMT | 0.44 | 0.16 to 1.20 | 0.40 | 0.10 to 1.62 | 0.39 | 0.05 to 2.86 |
| Mixed | 0.46 | 0.28 to 0.75 | 0.37 | 0.18 to 0.77 | 0.38 | 0.13 to 1.08 |
| Otherd | 1.17 | 0.28 to 4.86 | 1.48 | 0.19 to 11.27 | — | — |
| Could not be assessed | 0.87 | 0.44 to 1.70 | 0.39 | 0.10 to 1.60 | 0.87 | 0.21 to 3.66 |
| Pretreatment CA-125 | ||||||
| ≤ 35 U/mL | 1.0 | ref | 1.0 | ref | 1.0 | ref |
| > 35 U/mL | 2.92 | 1.75 to 4.89 | 2.35 | 1.21 to 4.58 | 2.27 | 0.88 to 5.87 |
| Could not be assessed | 2.93 | 1.64 to 5.22 | 2.96 | 1.40 to 6.26 | 2.24 | 0.71 to 7.07 |
| Pretreatment pleural effusion | ||||||
| No | 1.0 | ref | 1.0 | ref | 1.0 | ref |
| Yes | 1.98 | 1.22 to 3.24 | 3.66 | 1.53 to 8.75 | 17.02 | 2.04 to 141.74 |
| Could not be assessed | 0.97 | 0.66 to 1.44 | 1.91 | 0.92 to 3.96 | 7.64 | 1.04 to 55.97 |
| Cytology of ascites/pelvic washings | ||||||
| Negative | 1.0 | ref | 1.0 | ref | 1.0 | ref |
| Positive | 5.49 | 3.72 to 8.09 | 5.58 | 3.33 to 9.36 | 4.67 | 2.20 to 9.91 |
| Atypical | 3.20 | 1.52 to 6.70 | 2.91 | 0.99 to 8.56 | 3.09 | 0.67 to 14.15 |
| Could not be assessed | 3.52 | 2.21 to 5.59 | 3.02 | 1.59 to 5.77 | 3.68 | 1.53 to 8.84 |
| Pretreatment ascites | ||||||
| No | 1.0 | ref | 1.0 | ref | 1.0 | ref |
| Yes | 2.85 | 2.08 to 3.89 | 2.77 | 1.79 to 4.29 | 2.97 | 1.52 to 5.81 |
| Could not be assessed | 1.10 | 0.27 to 4.50 | 2.00 | 0.48 to 8.41 | 2.54 | 0.33 to 19.73 |
| Lymph node involvement | ||||||
| No palpable nodes, no biopsies | 1.0 | ref | 1.0 | ref | 1.0 | ref |
| Palpable nodes, no biopsies | 1.48 | 0.64 to 3.38 | 5.39 | 2.10 to 13.82 | 6.53 | 0.84 to 50.92 |
| Biopsies negative | 0.30 | 0.22 to 0.42 | 0.36 | 0.23 to 0.58 | 0.43 | 0.21 to 0.88 |
| Biopsies positive | 1.16 | 0.82 to 1.64 | 1.41 | 0.84 to 2.37 | 2.06 | 0.93 to 4.56 |
| Could not be assessed | 0.59 | 0.19 to 1.87 | — | — | — | — |
| Synchronous primary tumor | ||||||
| No | 1.0 | ref | 1.0 | ref | 1.0 | ref |
| Yes, endometrial | 0.42 | 0.17 to 1.01 | 0.16 | 0.02 to 1.18 | 0.36 | 0.05 to 2.61 |
| Yes, othere | 1.20 | 0.44 to 3.25 | 1.61 | 0.39 to 6.66 | — | — |
| Residual disease after cytoreductive surgeryf | ||||||
| No | 1.0 | ref | 1.0 | ref | 1.0 | ref |
| Yes | 4.82 | 3.59 to 6.48 | 5.02 | 3.29 to 7.66 | 4.54 | 2.34 to 8.78 |
| Could not be assessed | 5.31 | 3.39 to 8.32 | 6.99 | 3.73 to 13.10 | 9.71 | 3.61 to 26.09 |
| Size of residual disease after cytoreductive surgery, cmf | ||||||
| No residual disease | 1.0 | ref | 1.0 | ref | 1.0 | ref |
| 0.1 to < 1.0 | 4.41 | 3.12 to 6.22 | 5.23 | 3.21 to 8.5 | 4.43 | 1.96 to 10.04 |
| 1.0 to < 2.0 | 5.62 | 3.50 to 9.02 | 6.86 | 3.32 to 14.19 | 11.12 | 3.77 to 32.84 |
| ≥ 2.0 | 6.72 | 3.85 to 11.75 | 1.40 | 0.19 to 10.18 | 2.76 | 0.37 to 20.51 |
| Could Not Be Assessed | 4.89 | 3.37 to 7.11 | 5.87 | 3.47 to 9.92 | 5.54 | 2.36 to 12.99 |
| Debulking at cytoreductive surgeryg | ||||||
| Optimal | 1.0 | ref | 1.0 | ref | 1.0 | ref |
| Suboptimal | 3.77 | 2.72 to 5.22 | 3.40 | 2.01 to 5.77 | 4.60 | 2.02 to 10.48 |
| Received neoadjuvant chemotherapy | 2.99 | 1.89 to 4.72 | 1.31 | 0.48 to 3.58 | 2.50 | 0.76 to 8.20 |
| No primary surgery performed | 1.70 | 0.42 to 6.95 | — | — | — | — |
| Unknown | 3.76 | 1.91 to 7.40 | 4.27 | 1.56 to 11.70 | 3.60 | 0.49 to 26.39 |
| Platinum chemotherapy, no. of cyclesh,i | ||||||
| No | 1.0 | ref | 1.0 | ref | 1.0 | ref |
| 0 to ≤ 3 | 2.21 | 0.63 to 7.85 | 3.80 | 0.74 to 19.59 | 2.33 | 0.39 to 13.93 |
| 3 to ≤ 6 | 5.66 | 2.09 to 15.31 | 6.29 | 1.54 to 25.70 | 2.38 | 0.56 to 10.11 |
| > 6 | 9.96 | 3.64 to 27.24 | 10.72 | 2.57 to 44.76 | 6.59 | 1.51 to 28.67 |
| Yes, number of cycles unknown | 2.46 | 0.27 to 22.02 | 5.14 | 0.46 to 56.88 | — | — |
| Taxane chemotherapy, no. of cycles)h,j | ||||||
| No | 1.0 | ref | 1.0 | ref | 1.0 | ref |
| 0 to ≤ 3 | 1.50 | 0.54 to 4.14 | 1.34 | 0.36 to 4.99 | 1.66 | 0.33 to 8.23 |
| 3 to ≤ 6 | 3.52 | 1.72 to 7.19 | 2.96 | 1.19 to 7.36 | 2.15 | 0.65 to 7.14 |
| > 6 | 6.82 | 3.29 to 14.14 | 6.03 | 2.35 to 15.47 | 4.49 | 1.27 to 15.92 |
| Yes, number of cycles unknown | 1.84 | 0.39 to 8.66 | 2.95 | 0.57 to 15.23 | 2.54 | 0.26 to 24.67 |
| Other chemotherapy, no. of cyclesh,k | ||||||
| No | 1.0 | ref | 1.0 | ref | 1.0 | ref |
| 0 to ≤ 3 | 1.01 | 0.32 to 3.16 | 1.53 | 0.38 to 6.24 | — | — |
| 3 to ≤ 6 | 1.75 | 1.03 to 2.98 | 2.59 | 1.25 to 5.36 | 3.90 | 1.38 to 11.00 |
| > 6 | 2.29 | 1.39 to 3.78 | 2.13 | 0.93 to 4.88 | 4.34 | 1.53 to 12.31 |
| Yes, number of cycles unknown | 4.66 | 1.72 to 12.64 | 18.13 | 4.28 to 76.72 | — | — |
| Maintenance chemotherapy | ||||||
| No | 1.0 | ref | 1.0 | ref | 1.0 | ref |
| Yes | 1.79 | 1.21 to 2.64 | 3.51 | 2.15 to 5.71 | 3.43 | 1.51 to 7.78 |
| Number of chemotherapy cycles before normalization of CA-125 | ||||||
| Normalized without/prior to chemotherapy | 1.0 | ref | 1.0 | ref | 1.0 | ref |
| 1 to < 3 | 2.56 | 1.71 to 3.84 | 1.80 | 1.06 to 3.05 | 2.29 | 1.08 to 4.85 |
| 3 to < 6 | 5.59 | 3.72 to 8.39 | 4.33 | 2.50 to 7.52 | 4.23 | 1.78 to 10.08 |
| ≥ 6 | 5.19 | 3.19 to 8.43 | 4.51 | 2.27 to 8.96 | 2.17 | 0.48 to 9.72 |
| Could not be assessed | 2.94 | 1.75 to 4.95 | 2.26 | 1.12 to 4.58 | 1.91 | 0.61 to 5.91 |
| Persistent disease after primary treatment | ||||||
| No | 1.0 | ref | 1.0 | ref | 1.0 | ref |
| Yes | 2.96 | 1.57 to 5.60 | 0.84 | 0.12 to 6.0 | — | — |
Abbreviations: HR, hazard ratio; MMT, mixed Mullerian tumor; ref, reference.
Landmark method was used for years 1 and 2. Please see Tables 1 and 2 for number of participants in the different categories.
HRs were calculated using Cox regression models adjusted for current age (continuous) and disease-free survival was measured from the specified time point.
One patient was missing stage information because she never had staging or cytoreductive surgeries and was never formally staged by oncologist.
Includes one micropapillary serous, one adenosquamous, one papillary serous with multiple psammoma bodies.
Includes one of each of the following synchronous cancers: fallopian tube, granulosa cell tumor of the ovary, recurrent breast, GI stromal, skin, and appendiceal.
Excludes three patients that did not have cytoreductive surgery.
Patients were considered to be optimally debulked if their disease was <1 cm or their surgeon/oncologist declared them to be optimally debulked at the conclusion of their cytreductive surgery.
Includes neoadjuvant, adjuvant and maintenance chemotherapies received as well as any chemotherapy received for persistent disease.
Includes carboplatin, cisplatin, oxaliplatin, and abraxane.
Includes taxol, taxotere, and xyotax.
Includes avastin, doxil, topotecan, gemzar, cytoxan, interferon, mytomycin, erbitux, ifosphomaide, catumaxomab, and ovarex. Many of these other chemotherapies were given as part of a clinical trial and in some cases it was unclear whether participants received placebo or the active agent; cases that were reported to have gotten the placebo were considered to have received no chemotherapy.