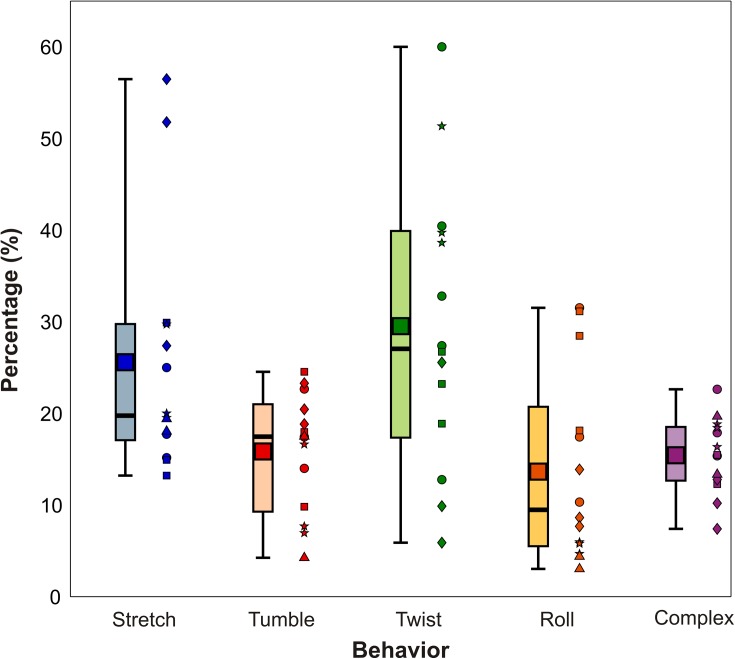
FIG. 2.
Box plot showing the fraction of RBCs exhibiting different mechanical responses upon entering a constriction. The top and bottom of the lightly shaded rectangles indicate the 25th and 75th quartiles, respectively, the thick black bars indicate the median, the dark square markers indicate the mean, and the whiskers represent the maximum and minimum values observed. The distributions are based on fourteen separate trials using five different blood donors. We ran 3 trials for each donor and show the individual data points adjacent to the box plot. Each marker shape represents a separate donor. The total number of cells observed per trial was n1 = 1262, n2 = 876, n3 = 1168, n4 = 779, and n5 = 348.

