FIG. 5.
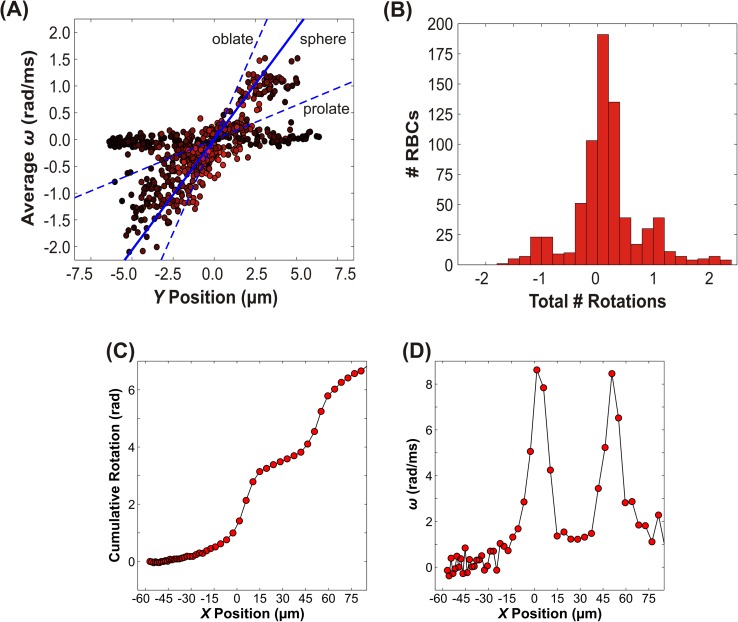
Dynamics of tumbling RBCs. (a) The average angular velocity versus Y position in the microchannel. The color of each data point is weighted based on the normalized linear velocity. Lighter color corresponds to a higher velocity while darker color indicates lower velocity. Positive values of rotation and angular velocity correspond to clockwise rotations, while negative values correspond to counterclockwise rotations. The dashed lines indicate the predicted angular velocity for an oblate and prolate ellipsoid using rigid body theory; the solid line is for a sphere (cf. Eqs. (1) and (5)). (b) Histogram of the total number of rotations observed within the field of view. Each rotation of 180° was counted as 1 full rotation. Note that the maximum number of rotations occurs most frequently at integer values. (c) The cumulative rotation and (d) the corresponding instantaneous angular velocity vs. X position for an individual representative tumbling cell. Solid lines are guides for the eye. Note that the angular velocity peaks when the cell is oriented transverse to the flow direction (i.e., oblate).

