
Figure 2.
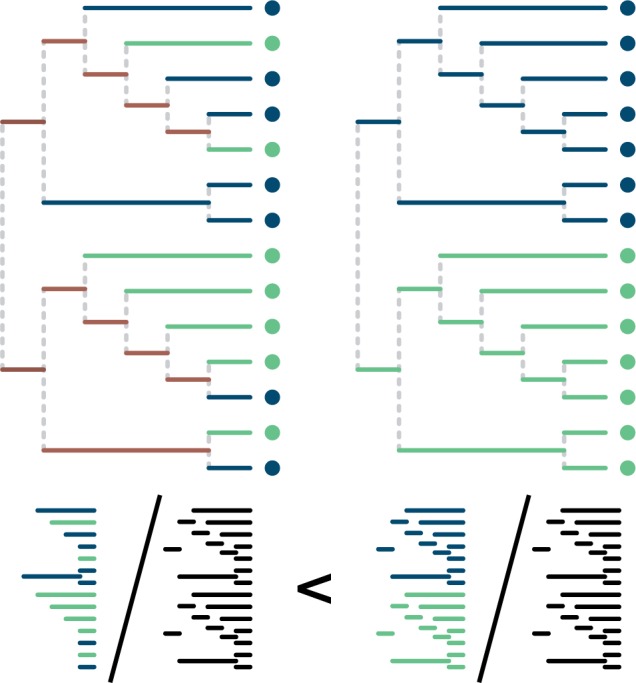
The UniFrac divergence measure (figure adapted from Lozupone and Knight 2005). Assume that the sequence data to build the phylogenetic tree derives from two samples: the light-shaded sample and the dark-shaded sample (green and blue in the online version). When the samples are interspersed across the tree (left tree), they have a smaller fraction of branch length that sits ancestral to clades that are uniquely composed of one sample or another, compared with when they are separate (right tree). The bottom pictorial equation shows the ratios of interest for UniFrac: the branch length unique to one sample divided by the total branch length. The ratio is smaller when the samples are interspersed (left) than they are when separate (right tree).