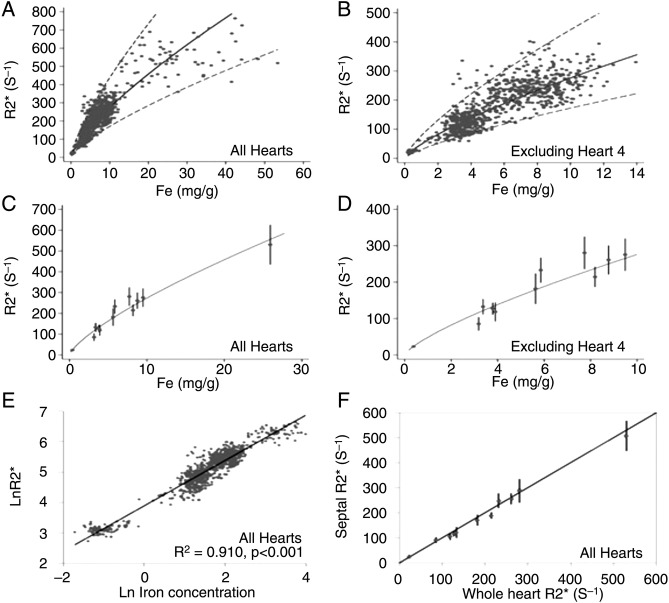
Figure 2.
Adapted from Carpenter et al correlated T2* values to myocardial iron content. The regression (solid line) and 95% confidence bands (dotted lines) are shown and derived from analysis of the log-log data shown in E. (A) R2* plotted versus myocardial iron concentration measured from each myocardial region of interest (ROI). (B) R2* versus myocardial iron concentration excluding heart 4. (C) Mean R2* plotted versus mean iron concentration for each heart. (D) Mean R2* versus mean iron concentration excluding heart 4. (E) ln(R2*) plotted versus ln((Fe)) for all ROIs, including heart 4, showing the best-fit linear regression line. (F) Mean midseptal R2* versus mean whole-heart R2* plotted against the line of identity showing that the septal R2* value is highly representative of the whole-heart R2*.

