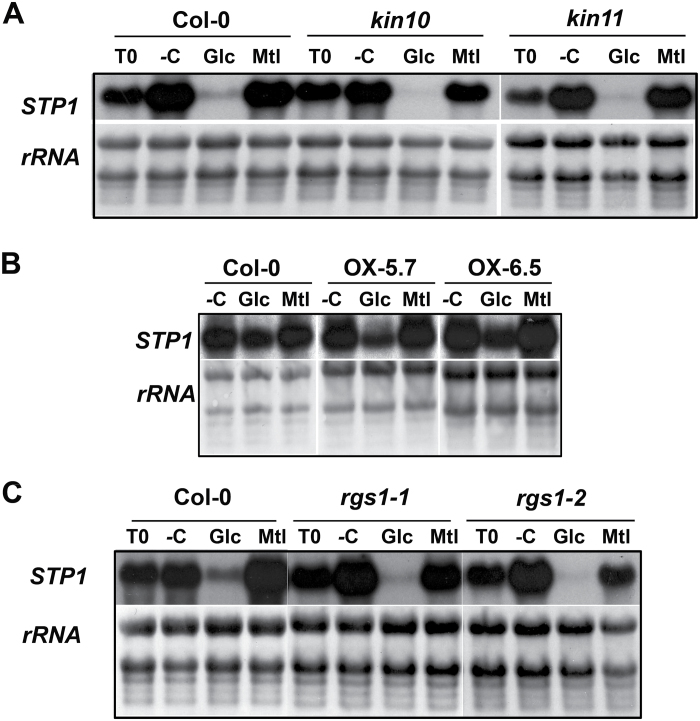
Fig. 4.
STP1 sugar regulation in SnRK1 and RGS1 mutants. Total RNA was obtained from 12-day-old kin10 and kin11 mutants (A), from two independent overexpressing KIN10 (OX5.7 and OX6.5) lines (B), and from rgs1-1 and rgs1-2 (C). After carbon starvation for 2 days, the plants were transferred to media depleted of sugar (–C) or with 150mM Glc or Mtl for 6h (A and C) or with 5mM Glc or Mtl for 30 min (B). Ten micrograms of total RNA was used from each sample for northern analysis and was hybridized with the STP1 probe. T0 represents the level of STP1 prior to the sugar treatment. The rRNA from the methylene blue-stained membranes is shown as a loading control. Membranes shown are representative of two biologically independent experiments.

