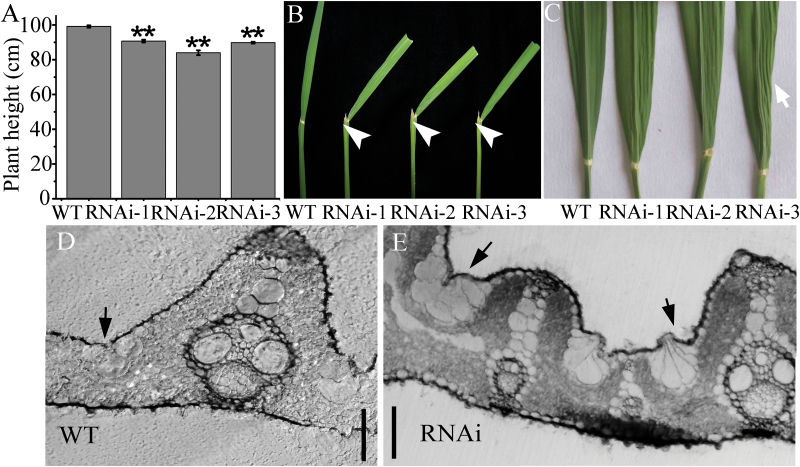
Fig. 6.
Vegetative phenotypic analyses of OsIG1-RNAi transgenic lines. (A) Plant height (cm). Student’s t test was used to analyse significant differences between WT and OsIG1-RNAi transgenic lines. Values are means ± SE from 20 plants. **P < 0.01 (t test). (B) Showing the increased leaf angle in OsIG1-RNAi transgenic lines. Arrows indicate the leaf lamina joint. (C) Some leaves of OsIG1-RNAi lines showing wrinkled blades, which was partially similar to that of plants overexpressing the class 1 KNOX gene OSH1. (D, E) Cross-sections of a WT (D) and OsIG1-RNAi (E) leaf blade. Arrows indicate bulliform cells. Scale bars, 50 µm. A colour version of this figure is available at JXB online.

