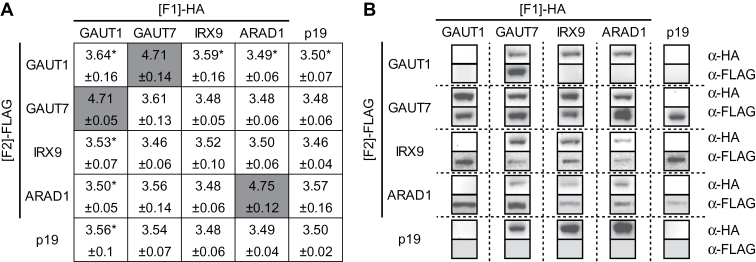
Fig. 4.
Rluc-PCA identifies the GAUT1–GAUT7 core-complex and ARAD1–ARAD1 homodimer. (A) Heat map of Log10 values of RLU where dark grey denotes statistically significant higher Log10 values of RLU above the background level (p19). Statistical analysis was performed on the averages derived from three independent experiments, each consisting of three biological replicates (pools) (see materials and methods). A vector containing the silencing suppressor p19 was co-transfected along with GOI–hRluc[F1] and GOI–hRluc[F2]. Error represents 95% confidence interval, n=3. Asterisk represents extracts where GAUT1 was not detected by immunoblot owing to proteolytic processing and possible degradation (Atmodjo et al., 2011). (B) Immunoblot of expressed proteins probed with anti-HA and anti-FLAG primary antibodies.

