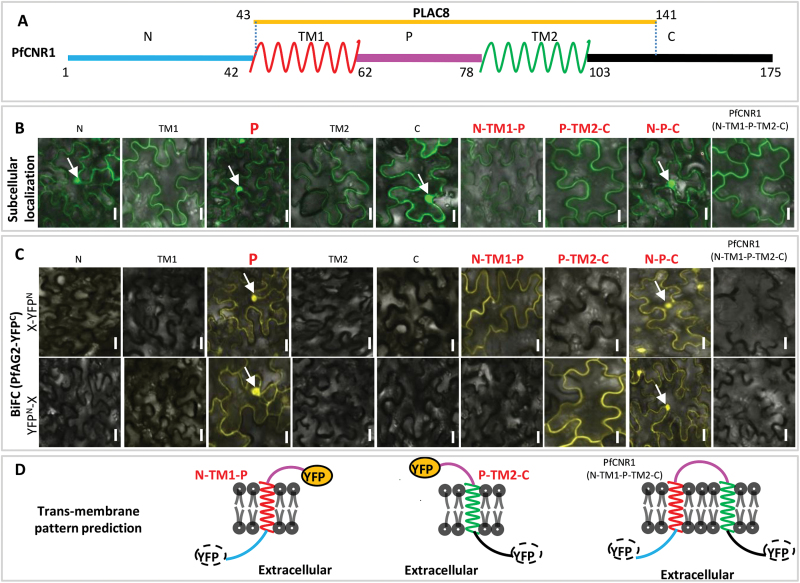
Fig. 5.
Interaction between PfAG2 and the membrane-anchored PfCNR1. (A) Subsections of PfCNR1 based on computational prediction. Different sections of the protein are highlighted in colour. N, N-terminal region; TM (TM1 and TM2), transmembrane domain; P, the portion between two transmembrane domains; C, C-terminal region. The number indicates the position of the amino acids of the two ends of each section. (B) Subcellular localization of each section of PfCNR1. The fusion protein of each section with GFP was transiently expressed in plant cells. (C) BiFC assays. PfAG2–YFPc and each section of PfCNR1 were co-expressed in plant cells. X indicates different sections of PfCNR1. The arrow indicates the nuclei. Bars, 10 μm. (D) Subcellular localization predication of each section of PfCNR1 and the mutated PfCNR1. The predication was performed according to the observations in (B) and (C). The dash-circled YFP indicates that the YFP signal was not seen when YFPn was fused at the extracellular end, while the solid-circled yellow YFP indicates that the YFP signal was detected once the YFPn was fused at the intracellular end. The colours of each PfCNR1 section are as used in (A).

