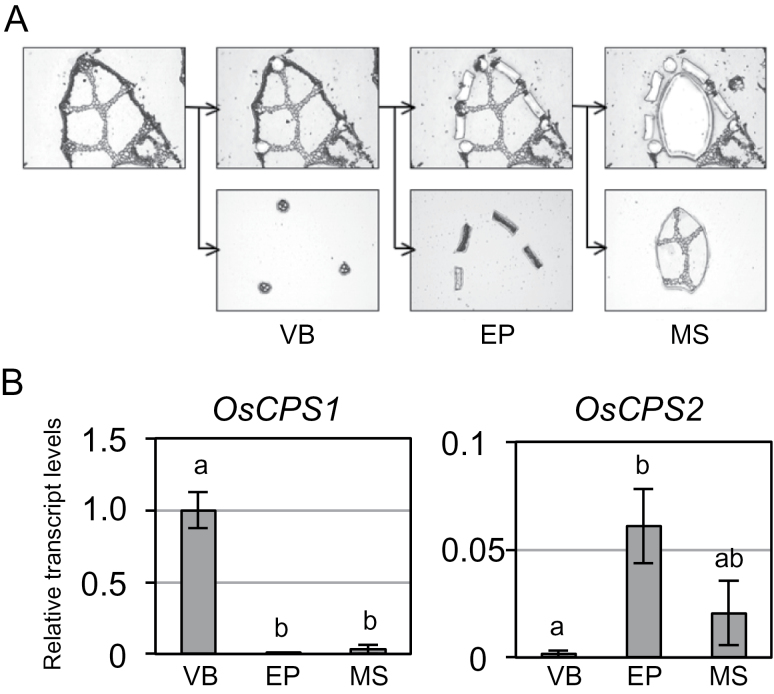
Fig. 4.
Localization of transcripts of OsCPS1 and OsCPS2 to different tissues in the upper part of the second-leaf sheath of rice. (A) Tissue samples collected by laser microdissection. Vascular bundle-rich (VB), epidermal-rich (EP), and mesophyll-rich (MS) tissues were collected from segments of the upper parts of the second-leaf sheaths of rice. (B) Relative transcript levels of two rice CPS genes in VB, EP, and MS tissues. Expression analysis was performed by qRT–PCR. The concentration of each transcript was normalized to that of 18S rRNA and adjusted to a value of 1 for OsCPS1 in VB with SEs (n=3). Data were subjected to analysis of variance (ANOVA) in each graph.

