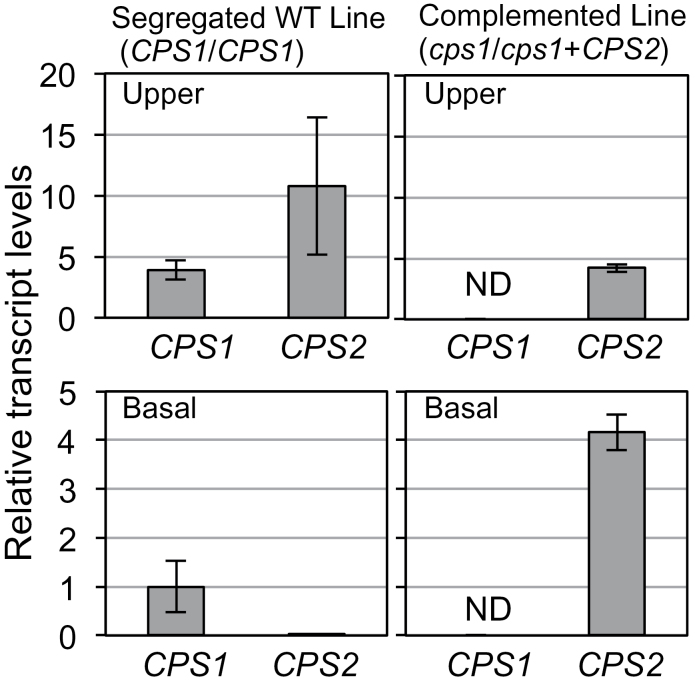
Fig. 7.
Expression patterns of OsCPS1 and OsCPS2 in second-leaf sheaths of the complemented line rice seedlings. The upper and basal parts of the second-leaf sheath (Fig. 3A) of T2 seedlings, obtained from the segregated wild-type T1 line (line 1, no. 8) and the complemented T1 line (line 1, no. 2) rice plants, were used for expression analyses by qRT–PCR. The concentration of each transcript was normalized to that of 18S rRNA, and adjusted to a value of 1 for OsCPS1 in the basal parts of the segregated wild-type line plants with SEs (n=3). ND, not detected.

