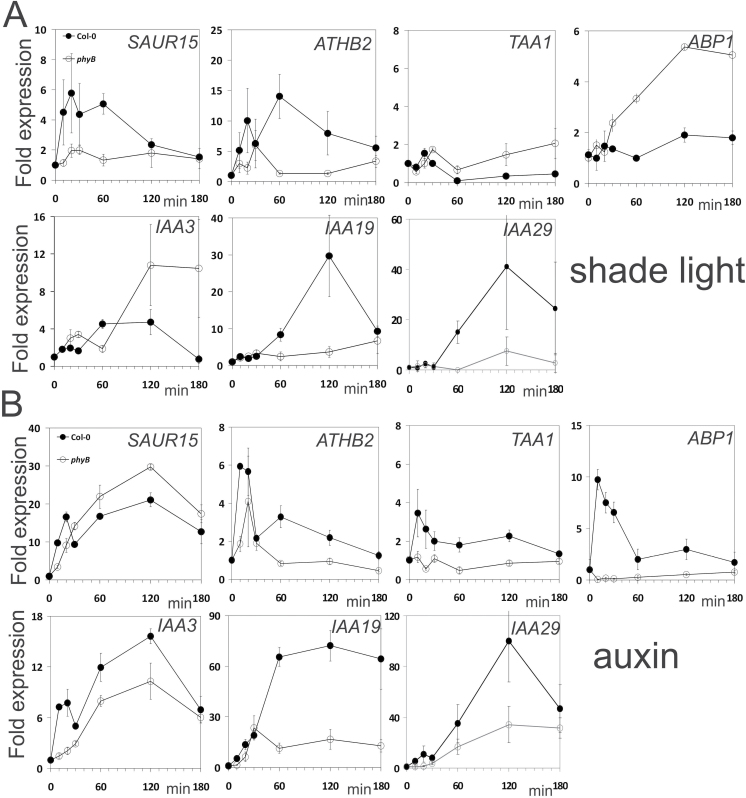
Fig. 8.
Differential co-regulation of expression of auxin- and light-induced genes in phyB and Col wt seedlings. Seedlings were grown for 3 d in w light and then treated in (A) with additional FR in LR light or (B) treated with 10 µM IAA for the times indicated in the graphs. Black symbols: Col; white symbols: phyB. qPCR data were obtained from two biological replications with three technical replications for each gene target. Statistical analysis was as described (Livak and Schmittgen, 2001; Pfaffl et al., 2002). At t=0min fold expression was set as 1 for each genotype. Values within one graph are significantly different when error bars or symbols do not overlap (P<0.05).

