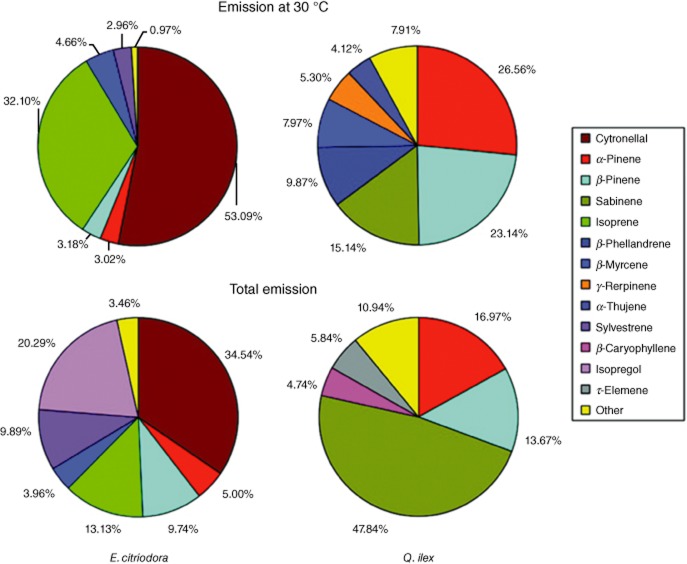
Figure 4.
Comparison between isoprenoid emission, shown as percentage of total isoprenoid emission, from Eucalyptus citriodora and Quercus ilex leaves measured at 30 °C (upper panels) and during a progressive increase in temperature from 30 to 90 °C (bottom panels) (Centritto et al. unpublished results). Other = sum isoprenoid with an emission rate lower than 3% of the total emission.

