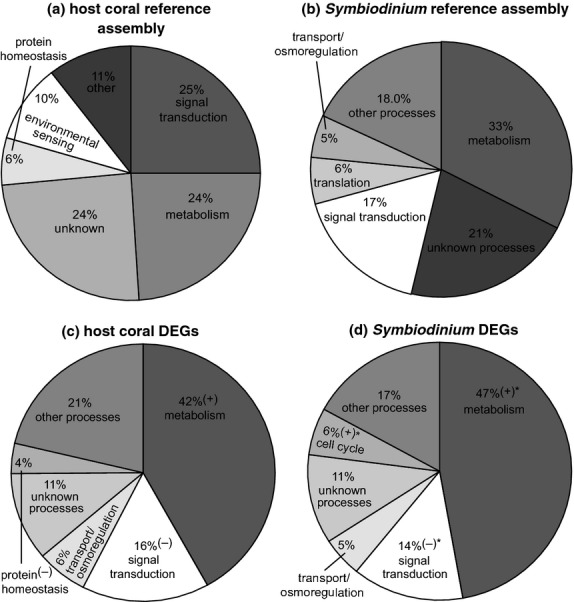
Fig 2.

Functional distribution of differentially expressed genes (DEGs). A gene ontology (GO) was assigned to a high percentage of the 48 288-contig host coral (a) and 15 374-contig Symbiodinium (b) reference assemblies. A subset of 970 host coral (c) and 879 Symbiodinium (d) DEGs (repeated-measures anova, P < 0.01) was then analysed separately and assigned GO functional category tags. In (c-d), GO categories that were down- or up-regulated relative to the respective reference assembly for each compartment (two-sample proportion test, P < 0.01) are marked with a ‘(−)’ or a ‘(+),’ respectively. When neither icon has been placed next to a GO category in (c–d), the respective GO category was represented at a similar proportion as in the respective reference assembly for that compartment (two-sample proportion test, P > 0.01). GO category percentages that differed significantly between host coral and Symbiodinium DEG pools are denoted by asterisks (‘*’) in (d). In all panels, ‘unknown processes’ refer to contigs for which GO tags could be assigned, although the GOs did not correspond to a particular cellular process (e.g., ‘diabetes’).
