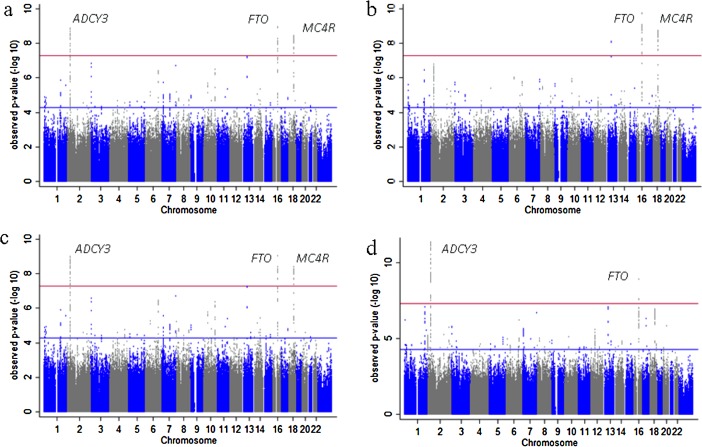
Figure 2.
Manhattan plots of the results from genome-wide association studies (GWAS) on BMI. (a) ALSPAC GWAS on BMI[3.1] adjusted for sex and age, (b) ALSPAC GWAS on BMI adjusted for sex and age, (c) ALSPAC GWAS on BMI adjusted for sex, age, and height, and (d) meta-analysis of ALSPAC and Generation R GWAS on BMI adjusted for sex, age, and height. [Avon Longitudinal Study of Parents and Children (ALSPAC)].

