
Figure 4.
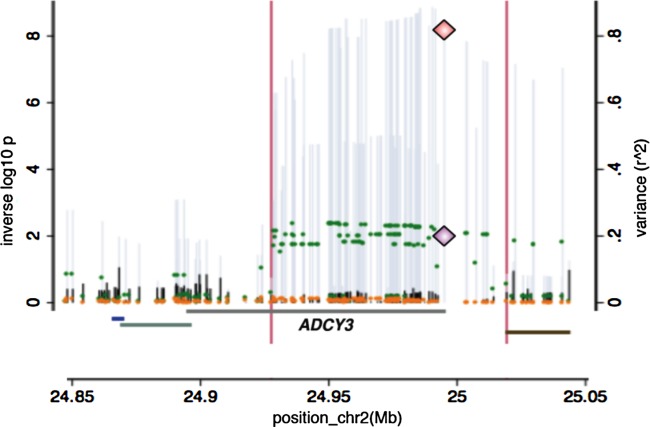
Genetic and expression data on the ADCY3 (adenylate cyclase 3) locus. Overlay of the GWAS on BMI adjusted for height results (left axis and grey spikes), the GWAS on BMI adjusted for height conditioning on rs11676272 dose (left axis and black spikes), the association of the expression of ADCY3 by the same variants in the region (expressed as r2 on the right axis and green dots) and the residual variation in expression after regression on rs11676272 (orange dots). The diamonds indicate the position of rs11676272 p values for the test for association with BMI adjusted for height (top diamond) and gene expression results expressed as r2 (bottom diamond).