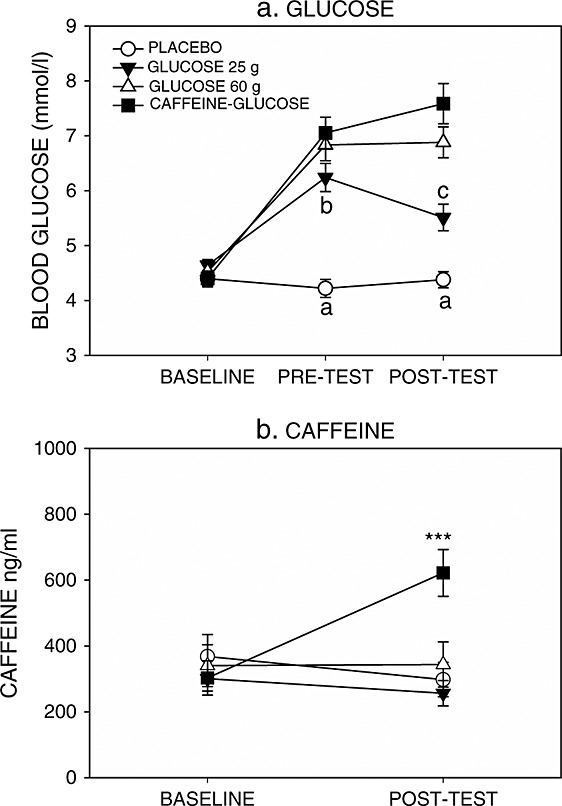
Figure 2.

Mean ± standard error of mean blood glucose levels (top) and salivary caffeine levels (bottom). For blood glucose a, significantly different to all other drink conditions; b, significantly different from caffeine–glucose; c, significantly different from 60 g glucose and caffeine–glucose at same time point. For salivary caffeine levels ***p < 0.005 at same time point
