Figure 3.

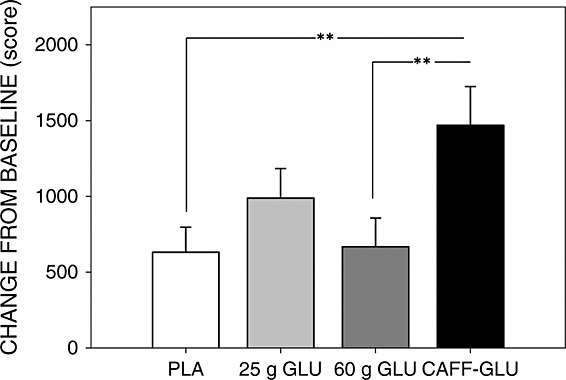
Effects of treatment on multi-tasking performance. Bars show mean change from baseline scores ± standard error of mean. **p < 0.01

Effects of treatment on multi-tasking performance. Bars show mean change from baseline scores ± standard error of mean. **p < 0.01