
Figure 2.
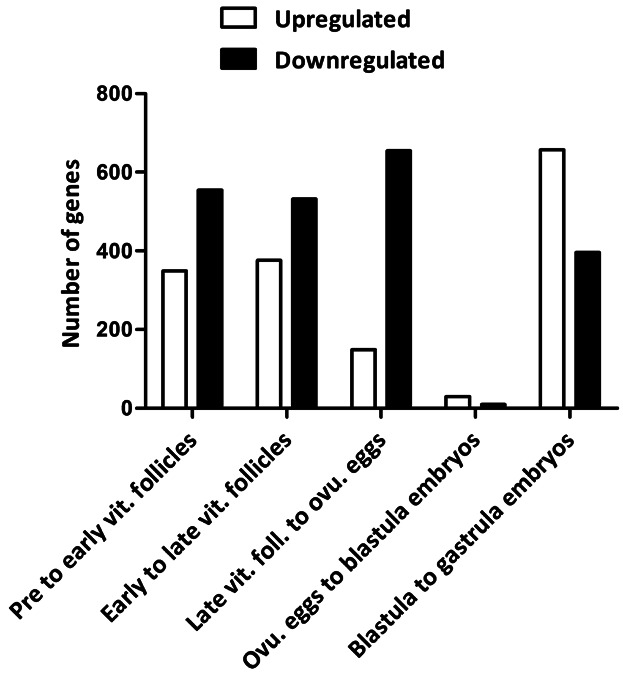
Number of up- and downregulated genes between specific stages of oogenesis and embryogenesis in Atlantic cod. Number of up- (white bars) and downregulated genes (black bars) (y-axis) are shown for each stage comparison (x-axis). vit., vitellogenic; foll., follicles; ovu., ovulated.