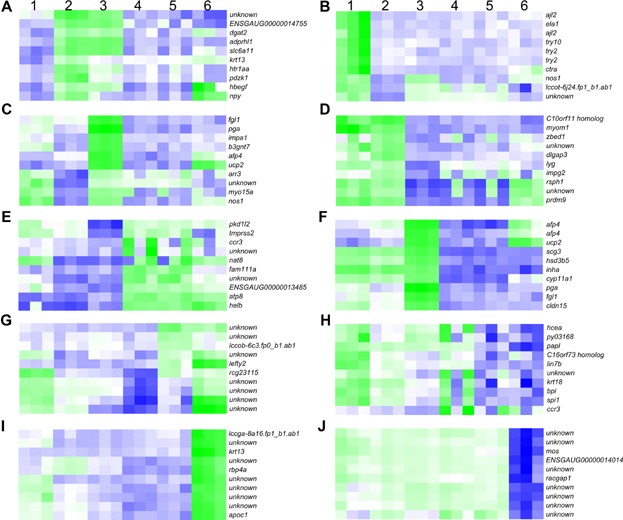
Figure 4.

Heat maps of the expression of the most-regulated (based on fold change) genes from one developmental stage to the next in Atlantic cod, ranging from pre-vitellogenic follicles to gastrulating embryos. The most-up-/downregulated genes are shown for periods between: (A, B) pre- to early-vitellogenic follicles; (C, D) early- to late-vitellogenic follicles; (E, F) late-vitellogenic follicles to ovulated eggs; (G, H) ovulated eggs to blastula embryos; (I, J) blastula to gastrula embryos. 1, pre-vitellogenic follicles; 2, early-vitellogenic follicles; 3, late-vitellogenic follicles; 4, unfertilized eggs; 5, blastula; 6, gastrula. Green and blue colors represent up- and downregulation of genes, respectively. In cases of predicted genes, the Ensembl gene IDs (when possible) or GenBank EST ID's are shown. The predicted genes include: ENSGAUG00000014755, similar to protein tyrosine phosphatase, receptor type, Q isoform 1 precursor; lccot-6j24.fp1_b1.ab1, similar to F57G4.9; ENSGAUG00000013485, hypothetical protein LOC100005938; lccob-6c3.fp0_b1.ab1, similar to predicted protein; lccga-8a16.fp1_b1.ab1, hypothetical protein; and ENSGAUG00000014014, hypothetical protein LOC559540.
