
Figure 2.
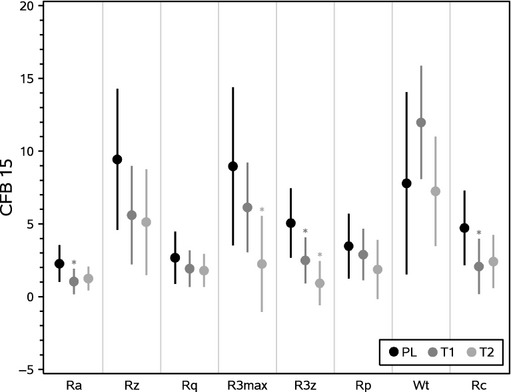
Means plot + Standard Error of the Mean (SEM). PRIMOS analysis generates quantitative data for several parameters with relation to the 3D profile of the skin including Ra, Rz, Rq, R3Max, R3z, Rp, Wt and Rc. Placebo (PL), Test group 1 (T1) and Test group 2 (T2).